3M 2010 Annual Report Download - page 74
Download and view the complete annual report
Please find page 74 of the 2010 3M annual report below. You can navigate through the pages in the report by either clicking on the pages listed below, or by using the keyword search tool below to find specific information within the annual report.-
 1
1 -
2
-
3
-
4
-
5
-
6
-
7
-
8
-
9
-
10
-
11
-
12
-
13
-
14
-
15
-
16
-
17
-
18
-
19
-
20
-
21
-
22
-
23
-
24
-
25
-
26
-
27
-
28
-
29
-
30
-
31
-
32
-
33
-
34
-
35
-
36
-
37
-
38
-
39
-
40
-
41
-
42
-
43
-
44
-
45
-
46
-
47
-
48
-
49
-
50
-
51
-
52
-
53
-
54
-
55
-
56
-
57
-
58
-
59
-
60
-
61
-
62
-
63
-
 64
64 -
 65
65 -
 66
66 -
 67
67 -
 68
68 -
 69
69 -
 70
70 -
 71
71 -
 72
72 -
 73
73 -
 74
74 -
 75
75 -
 76
76 -
 77
77 -
 78
78 -
 79
79 -
 80
80 -
 81
81 -
 82
82 -
 83
83 -
 84
84 -
85
-
86
-
87
-
88
-
89
-
90
-
91
-
92
-
93
-
94
-
95
-
96
-
97
-
98
-
99
-
100
-
101
-
102
-
103
-
104
-
105
-
106
-
107
-
108
-
109
-
110
-
111
-
112
-
113
-
114
-
115
-
116
-
117
-
118
-
119
-
120
-
121
-
122
-
123
-
124
-
125
-
126
-
127
-
128
-
129
-
130
-
131
-
132
 |
 |

68
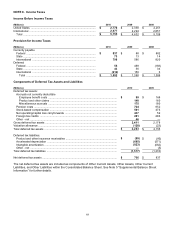
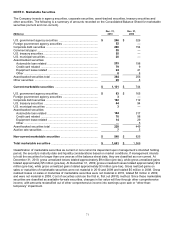
NOTE 8. Income Taxes
Income Before Income Taxes
(Millions)
2010
2009
2008
United States ......................................................................................
$
2,778
$
2,338
$
2,251
International ........................................................................................
2,977
2,294
2,857
Total ................................................................................................
$
5,755
$
4,632
$
5,108
Provision for Income Taxes
(Millions)
2010
2009
2008
Currently payable
Federal ............................................................................................
$
837
$
88
$
882
State ................................................................................................
73
13
14
International ....................................................................................
796
586
820
Deferred
Federal ............................................................................................
55
489
(168
)
State ................................................................................................
43
56
34
International ....................................................................................
(212
)
156
6
Total ............................................................................................
$
1,592
$
1,388
$
1,588
Components of Deferred Tax Assets and Liabilities
(Millions)
2010
2009
Deferred tax assets:
Accruals not currently deductible
Employee benefit costs ...........................................................................................
$
99
$
168
Product and other claims ........................................................................................
148
160
Miscellaneous accruals ...........................................................................................
175
180
Pension costs ..............................................................................................................
724
852
Stock-based compensation .........................................................................................
501
473
Net operating/capital loss carryforwards .....................................................................
437
59
Foreign tax credits ......................................................................................................
281
286
Other - net ...................................................................................................................
46
—
Gross deferred tax assets ...............................................................................................
2,411
2,178
Valuation allowance ........................................................................................................
(128
)
(23
)
Total deferred tax assets ................................................................................................
$
2,283
$
2,155
Deferred tax liabilities:
Product and other insurance receivables ....................................................................
$
(59
)
$
(80
)
Accelerated depreciation ............................................................................................
(695
)
(571
)
Intangible amortization ................................................................................................
(823
)
(662
)
Other - net ...................................................................................................................
—
(5
)
Total deferred tax liabilities .............................................................................................
(1,577
)
(1,318
)
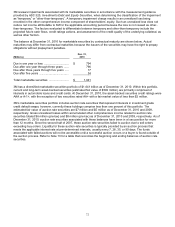
Net deferred tax assets ...................................................................................................
$
706
$
837
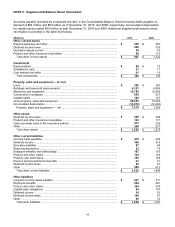
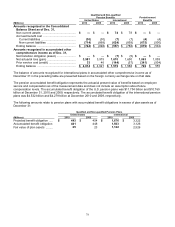
The net deferred tax assets are included as components of Other Current Assets, Other Assets, Other Current
Liabilities, and Other Liabilities within the Consolidated Balance Sheet. See Note 5 “Supplemental Balance Sheet
Information” for further details.