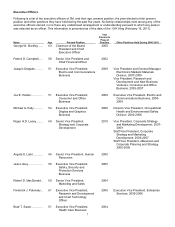
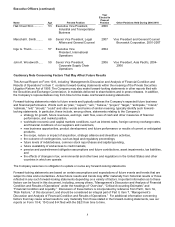
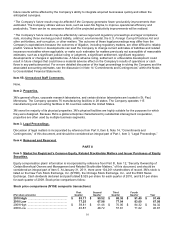
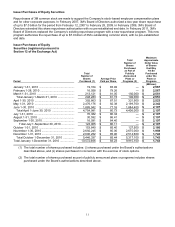
3M 2010 Annual Report Download - page 23
Download and view the complete annual report
Please find page 23 of the 2010 3M annual report below. You can navigate through the pages in the report by either clicking on the pages listed below, or by using the keyword search tool below to find specific information within the annual report.-
 1
1 -
2
-
3
-
4
-
5
-
6
-
7
-
8
-
9
-
10
-
11
-
12
-
 13
13 -
 14
14 -
 15
15 -
 16
16 -
 17
17 -
 18
18 -
 19
19 -
 20
20 -
 21
21 -
 22
22 -
 23
23 -
 24
24 -
 25
25 -
 26
26 -
 27
27 -
 28
28 -
 29
29 -
 30
30 -
 31
31 -
 32
32 -
 33
33 -
34
-
35
-
36
-
37
-
38
-
39
-
40
-
41
-
42
-
43
-
44
-
45
-
46
-
47
-
48
-
49
-
50
-
51
-
52
-
53
-
54
-
55
-
56
-
57
-
58
-
59
-
60
-
61
-
62
-
63
-
64
-
65
-
66
-
67
-
68
-
69
-
70
-
71
-
72
-
73
-
74
-
75
-
76
-
77
-
78
-
79
-
80
-
81
-
82
-
83
-
84
-
85
-
86
-
87
-
88
-
89
-
90
-
91
-
92
-
93
-
94
-
95
-
96
-
97
-
98
-
99
-
100
-
101
-
102
-
103
-
104
-
105
-
106
-
107
-
108
-
109
-
110
-
111
-
112
-
113
-
114
-
115
-
116
-
117
-
118
-
119
-
120
-
121
-
122
-
123
-
124
-
125
-
126
-
127
-
128
-
129
-
130
-
131
-
132
 |
 |

17
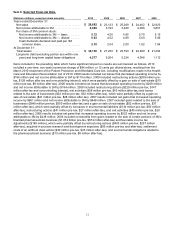
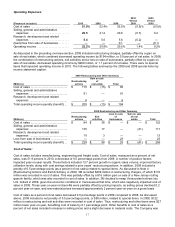
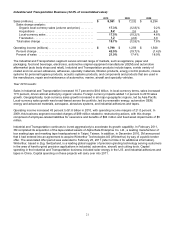
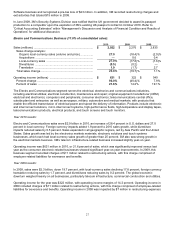
Operating Expenses:
(Percent of net sales)
2010
2009
2008
2010
Versus
2009
2009
Versus
2008
Cost of sales ..........................
51.9
%
52.4
%
52.9
%
(0.5
)%
(0.5
)%
Selling, general and administrative
expenses ...........................
20.5
21.2
20.8
(0.7
)
0.4
Research, development and related
expenses ...........................
5.4
5.6
5.6
(0.2
)
—
(Gain)/loss from sale of businesses .......
—
—
0.1
—
(0.1
)
Operating income ......................
22.2
%
20.8
%
20.6
%
1.4
%
0.2
%
As discussed in the preceding overview section, 2009 included restructuring charges, partially offset by a gain on
sale of real estate, which combined decreased operating income by $194 million, or 0.9 percent of net sales. In 2008,
the combination of restructuring actions, exit activities and a loss on sale of businesses, partially offset by a gain on
sale of real estate, decreased operating income by $269 million, or 1.1 percent of net sales. There were no special
items that impacted operating income in 2010. The following tables summarize the 2009 and 2008 special items by
income statement caption.
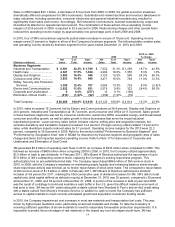
2009 Restructuring and Other Summary
(Millions)
Restructuring
actions
Gain on sale
of
real estate
Total
Cost of sales ..............................................
$
110
$
(15
)
$
95
Selling, general and administrative
expenses ...............................................
91
—
91
Research, development and related
expenses ...............................................
8
—
8
Total operating income penalty (benefit) ...
$
209
$
(15
)
$
194
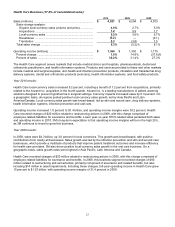
2008 Restructuring and Other Summary
(Millions)
Restructuring
actions
Exit
activities
Loss on sale
of
businesses
Gain on sale
of real
estate
Total
Cost of sales ..............................................
$
84
$
38
$
—
$
—
$
122
Selling, general and administrative
expenses ...............................................
135
17
—
(41
)
111
Research, development and related
expenses ...............................................
10
3
—
—
13
Loss from sale of businesses ....................
—
—
23
—
23
Total operating income penalty (benefit) ...
$
229
$
58
$
23
$
(41
)
$
269
Cost of Sales:
Cost of sales includes manufacturing, engineering and freight costs. Cost of sales, measured as a percent of net
sales, was 51.9 percent in 2010, a decrease of 0.5 percentage points from 2009. A number of positive factors
impacted year-on-year results. These factors included 13.7 percent growth in organic sales volume, improved factory
utilization levels, along with cost savings related to prior years’ restructuring actions. In addition, 2009 included a
penalty of 0.5 percentage points (as a percent of net sales) related to special items. As discussed in Note 4
(Restructuring Actions and Exit Activities), in 2009, 3M recorded $209 million in restructuring charges, of which $110
million was recorded in cost of sales. This was partially offset by a $15 million gain on sale of a New Jersey roofing
granule facility, which was also recorded in cost of sales. In addition, 3M decided to swap Venezuelan bolivars into
U.S. dollars in 2009, given the economic conditions in Venezuela at that time, which also negatively impacted cost of
sales in 2009. These year-on-year net benefits were partially offset by pricing impacts, as selling prices declined 0.2
percent year-on-year, and raw material prices increased approximately 2 percent year-on-year on a gross basis.
Cost of sales as a percent of net sales decreased 0.5 percentage points in 2009 compared to 2008. As discussed
above, 2009 included a net penalty of 0.5 percentage points, or $95 million, related to special items. In 2008, $122
million in restructuring and exit activities were recorded in cost of sales. Thus, restructuring and other items were $27
million lower year-on-year, benefiting cost of sales by 0.1 percentage point. Other benefits to cost of sales as a
percent of net sales included increases in selling prices and a slight decrease in material costs. The Company was