3M 2010 Annual Report Download - page 42
Download and view the complete annual report
Please find page 42 of the 2010 3M annual report below. You can navigate through the pages in the report by either clicking on the pages listed below, or by using the keyword search tool below to find specific information within the annual report.-
 1
1 -
2
-
3
-
4
-
5
-
6
-
7
-
8
-
9
-
10
-
11
-
12
-
13
-
14
-
15
-
16
-
17
-
18
-
19
-
20
-
21
-
22
-
23
-
24
-
25
-
26
-
27
-
28
-
29
-
30
-
31
-
 32
32 -
 33
33 -
 34
34 -
 35
35 -
 36
36 -
 37
37 -
 38
38 -
 39
39 -
 40
40 -
 41
41 -
 42
42 -
 43
43 -
 44
44 -
 45
45 -
 46
46 -
 47
47 -
 48
48 -
 49
49 -
 50
50 -
 51
51 -
 52
52 -
53
-
54
-
55
-
56
-
57
-
58
-
59
-
60
-
61
-
62
-
63
-
64
-
65
-
66
-
67
-
68
-
69
-
70
-
71
-
72
-
73
-
74
-
75
-
76
-
77
-
78
-
79
-
80
-
81
-
82
-
83
-
84
-
85
-
86
-
87
-
88
-
89
-
90
-
91
-
92
-
93
-
94
-
95
-
96
-
97
-
98
-
99
-
100
-
101
-
102
-
103
-
104
-
105
-
106
-
107
-
108
-
109
-
110
-
111
-
112
-
113
-
114
-
115
-
116
-
117
-
118
-
119
-
120
-
121
-
122
-
123
-
124
-
125
-
126
-
127
-
128
-
129
-
130
-
131
-
132
 |
 |

36
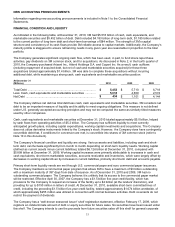
Free Cash Flow (non-GAAP measure):
In addition, to net cash provided by operating activities, 3M uses free cash flow as a useful measure of performance
and as an indication of the strength of the Company and its ability to generate cash. 3M defines free cash flow as net
cash provided by operating activities less purchases of property, plant and equipment (which is classified as an
investing activity). Free cash flow is not defined under U.S. generally accepted accounting principles (GAAP).
Therefore, it should not be considered a substitute for income or cash flow data prepared in accordance with U.S.
GAAP and may not be comparable to similarly titled measures used by other companies. It should not be inferred
that the entire free cash flow amount is available for discretionary expenditures. Below find a recap of free cash flow
for 2010, 2009 and 2008.
Years ended December 31
(Millions)
2010
2009
2008
Net cash provided by operating activities ......................................
$
5,174
$
4,941
$
4,533
Purchases of property, plant and equipment (PP&E) ...................
(1,091
)
(903
)
(1,471
)
Free Cash Flow .............................................................................
$
4,083
$
4,038
$
3,062
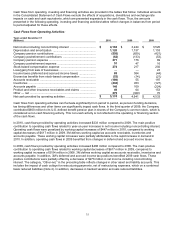
Cash Flows from Investing Activities:
Years ended December 31
(Millions)
2010
2009
2008
Purchases of property, plant and equipment (PP&E) ...................
$
(1,091
)
$
(903
)
$
(1,471
)
Proceeds from sale of PP&E and other assets .............................
25
74
87
Acquisitions, net of cash acquired .................................................
(1,830
)
(69
)
(1,394
)
Proceeds from sale of businesses ................................................
—
5
88
Purchases and proceeds from sale or maturities of marketable
securities and investments — net ..............................................
273
(839
)
291
Other investing activities ...............................................................
(66
)
—
—
Net cash used in investing activities .............................................
$
(2,689
)
$
(1,732
)
$
(2,399
)
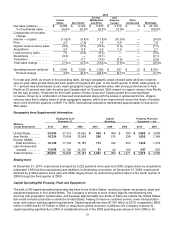
Investments in property, plant and equipment enable growth in diverse markets, helping to meet product demand and
increasing manufacturing efficiency. Capital spending increased to $1.091 billion in 2010, compared to $903 million
in 2009. In 2010, in the U.S., 3M invested in film manufacturing assets for optical systems and other non-optical
businesses which use similar technology. In Singapore, 3M is increasing capacity at its multi-purpose manufacturing
facility. 3M investments in the Industrial and Transportation business included solar energy in the U.S. and industrial
adhesives and tapes in China. 3M also invested in optical film capacity in Korea. Capital spending on some of the
preceding projects will carry over into 2011. The Company expects 2011 capital spending to be approximately $1.3
to $1.4 billion as 3M continues to fund growth opportunities around the world.
In response to global economic conditions, the Company reduced its capital spending significantly in 2009. A
substantial amount of the 2009 spending was carryover from 2008 or for tooling needed for new products and
continued operations. In 2008, major facility efforts included completion of production lines in the United States for
both Consumer and Office and Health Care, an R&D laboratory in Korea, a tape building in Poland, and numerous
tape lines and building expansions in China. In 2008, 3M also made progress towards completion of investments in a
Singapore multi-purpose manufacturing facility and film production facilities and made progress towards completion
of manufacturing cost reduction investments in two of its U.S. film manufacturing plants.
Refer to Note 2 for information on acquisitions. Note 2 also provides information on the proceeds from the sale of
businesses. The Company is actively considering additional acquisitions, investments and strategic alliances, and
from time to time may also divest certain businesses.
Purchases of marketable securities and investments and proceeds from sale (or maturities) of marketable securities
and investments are primarily attributable to asset-backed securities, agency securities, corporate medium-term note
securities and other securities, which are classified as available-for-sale. Interest rate risk and credit risk related to
the underlying collateral may impact the value of investments in asset-backed securities, while factors such as
general conditions in the overall credit market and the nature of the underlying collateral may affect the liquidity of
investments in asset-backed securities. The coupon interest rates for asset-backed securities are either fixed rate or
floating. Floating rate coupons reset monthly or quarterly based upon the corresponding monthly or quarterly LIBOR
rate. Each individual floating rate security has a coupon based upon the respective LIBOR rate +/- an amount
reflective of the credit risk of the issuer and the underlying collateral on the original issue date. Terms of the reset are
unique to individual securities. Fixed rate coupons are established at the time the security is issued and are based