3M 2010 Annual Report Download - page 31
Download and view the complete annual report
Please find page 31 of the 2010 3M annual report below. You can navigate through the pages in the report by either clicking on the pages listed below, or by using the keyword search tool below to find specific information within the annual report.-
 1
1 -
2
-
3
-
4
-
5
-
6
-
7
-
8
-
9
-
10
-
11
-
12
-
13
-
14
-
15
-
16
-
17
-
18
-
19
-
20
-
 21
21 -
 22
22 -
 23
23 -
 24
24 -
 25
25 -
 26
26 -
 27
27 -
 28
28 -
 29
29 -
 30
30 -
 31
31 -
 32
32 -
 33
33 -
 34
34 -
 35
35 -
 36
36 -
 37
37 -
 38
38 -
 39
39 -
 40
40 -
 41
41 -
42
-
43
-
44
-
45
-
46
-
47
-
48
-
49
-
50
-
51
-
52
-
53
-
54
-
55
-
56
-
57
-
58
-
59
-
60
-
61
-
62
-
63
-
64
-
65
-
66
-
67
-
68
-
69
-
70
-
71
-
72
-
73
-
74
-
75
-
76
-
77
-
78
-
79
-
80
-
81
-
82
-
83
-
84
-
85
-
86
-
87
-
88
-
89
-
90
-
91
-
92
-
93
-
94
-
95
-
96
-
97
-
98
-
99
-
100
-
101
-
102
-
103
-
104
-
105
-
106
-
107
-
108
-
109
-
110
-
111
-
112
-
113
-
114
-
115
-
116
-
117
-
118
-
119
-
120
-
121
-
122
-
123
-
124
-
125
-
126
-
127
-
128
-
129
-
130
-
131
-
132
 |
 |

25
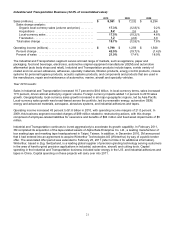
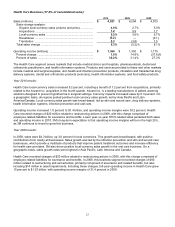
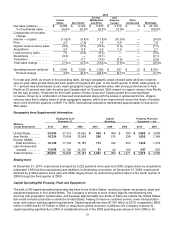
Consumer and Office Business (14.4% of consolidated sales):
2010
2009
2008
Sales (millions) ...........................................................................
$
3,853
$
3,471
$
3,578
Sales change analysis:
Organic local-currency sales (volume and price) ................
7.1
(3.1
)%
(0.8
)%
Acquisitions .........................................................................
2.9
2.6
1.8
Local-currency sales ...........................................................
10.0
%
(0.5
)%
1.0
%
Translation ..........................................................................
1.0
(2.5
)
1.4
Total sales change ..................................................................
11.0
%
(3.0
)%
2.4
%
Operating income (millions) .......................................................
$
840
$
748
$
683
Percent change .......................................................................
12.3
%
9.5
%
(3.8
)%
Percent of sales ......................................................................
21.8
%
21.5
%
19.1
%
The Consumer and Office segment serves markets that include consumer retail, office retail, home improvement,
building maintenance and other markets. Products in this segment include office supply products, stationery
products, construction and home improvement products (do-it-yourself), home care products, protective material
products, certain consumer retail personal safety products, and consumer health care products.
Year 2010 results:
Sales in Consumer and Office increased 11.0 percent in 2010 to $3.9 billion. Local-currency sales increased 10.0
percent, which included 7.1 percent from organic growth and 2.9 percent from acquisitions. Acquisition growth for
2010 was primarily comprised of the July 2009 acquisition of ACE® and related brands, which sells elastic bandage,
supports and thermometer product lines through consumer channels in North America, and the April 2010 acquisition
of the A-One branded label business. In addition, the January 2010 acquisition of Incavas Industria de Cabos e
Vassouras Ltda., a manufacturer of floor care products, contributed to acquisition sales growth. Foreign currency
impacts added 1.0 percent to sales growth.
2010 sales growth was broad-based, led by office supply products, consumer health care, home care, do-it-yourself
products and stationery products. On a geographic basis, sales growth was led by Asia Pacific, Latin
America/Canada and the United States.
Consumer and Office operating income increased 12.3 percent to $840 million, with operating income margins of
21.8 percent. In 2009, this business segment recorded charges of $13 million related to restructuring actions, with
this charge comprised of employee-related liabilities for severance and benefits.
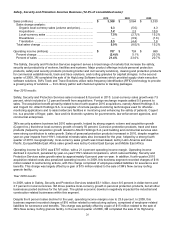
Year 2009 results:
In 2009, sales declined 3.0 percent to $3.5 billion, partially due to organic volume declines of 3.1 percent, driven by
lower spending by both retail consumers and commercial customers for most of the year. In addition, currency effects
decreased sales growth by 2.5 percent. Acquisitions contributed 2.6 percent to 2009 local-currency sales, largely
related to two purchases. In December 2008, 3M purchased Futuro, a leading supplier of braces, supports and
compression hosiery. In July 2009, 3M purchased ACE® Products, one of the strong consumer health care brands,
from Becton, Dickinson and Company. These investments, combined with 3M’s own successful brands, provide
critical mass in the retail drug store channel.
Operating income margins were at 21.5 percent for the year, up over 2 percentage points versus 2008. In 2009, this
business segment recorded charges of $13 million related to restructuring actions, with this charge comprised of
employee-related liabilities for severance and benefits. 2008 includes $18 million in restructuring charges.