3M 2010 Annual Report Download - page 104
Download and view the complete annual report
Please find page 104 of the 2010 3M annual report below. You can navigate through the pages in the report by either clicking on the pages listed below, or by using the keyword search tool below to find specific information within the annual report.-
 1
1 -
2
-
3
-
4
-
5
-
6
-
7
-
8
-
9
-
10
-
11
-
12
-
13
-
14
-
15
-
16
-
17
-
18
-
19
-
20
-
21
-
22
-
23
-
24
-
25
-
26
-
27
-
28
-
29
-
30
-
31
-
32
-
33
-
34
-
35
-
36
-
37
-
38
-
39
-
40
-
41
-
42
-
43
-
44
-
45
-
46
-
47
-
48
-
49
-
50
-
51
-
52
-
53
-
54
-
55
-
56
-
57
-
58
-
59
-
60
-
61
-
62
-
63
-
64
-
65
-
66
-
67
-
68
-
69
-
70
-
71
-
72
-
73
-
74
-
75
-
76
-
77
-
78
-
79
-
80
-
81
-
82
-
83
-
84
-
85
-
86
-
87
-
88
-
89
-
90
-
91
-
92
-
93
-
 94
94 -
 95
95 -
 96
96 -
 97
97 -
 98
98 -
 99
99 -
 100
100 -
 101
101 -
 102
102 -
 103
103 -
 104
104 -
 105
105 -
 106
106 -
 107
107 -
 108
108 -
 109
109 -
 110
110 -
 111
111 -
 112
112 -
 113
113 -
 114
114 -
115
-
116
-
117
-
118
-
119
-
120
-
121
-
122
-
123
-
124
-
125
-
126
-
127
-
128
-
129
-
130
-
131
-
132
 |
 |

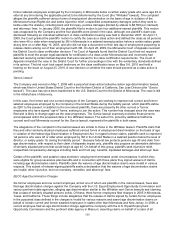
98
(Millions)
Fair Value
at
Dec. 31,
Fair Value Measurements
Using Inputs Considered as
Description
2009
Level 1
Level 2
Level 3
Assets:
Available-for-sale:
Marketable securities:
U.S. government agency securities ............
$
491
$
—
$
491
$
—
Corporate debt securities ............................
266
—
266
—
Asset-backed securities:
Automobile loan related ...........................
515
—
515
—
Credit card related ...................................
107
—
107
—
Equipment lease related ..........................
70
—
70
—
Other ........................................................
13
—
13
—
U.S. treasury securities ...............................
94
94
—
—
Auction rate securities .................................
5
—
—
5
Other securities ...........................................
8
—
8
—
Investments ....................................................
11
11
—
—
Derivative instruments — assets:
Foreign currency forward/option contracts .....
23
22
1
—
Commodity price swap contracts ....................
2
2
—
—
Interest rate swap contracts ...........................
54
—
54
—
Liabilities:
Derivative instruments — liabilities:
Foreign currency forward/option contracts .....
93
93
—
—
Commodity price swap contracts ....................
1
1
—
—
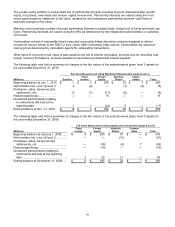
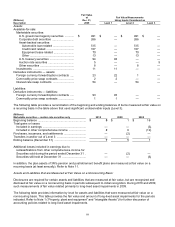
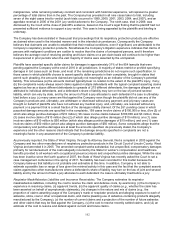
The following table provides a reconciliation of the beginning and ending balances of items measured at fair value on
a recurring basis in the table above that used significant unobservable inputs (Level 3).
(Millions)
Marketable securities — auction rate securities only
2010
2009
2008
Beginning balance .............................................................
$
5
$
1
$
16
Total gains or losses:
Included in earnings .......................................................
—
—
(3
)
Included in other comprehensive income ......................
2
6
(12
)
Purchases, issuances, and settlements ............................
—
(2
)
—
Transfers in and/or out of Level 3 .....................................
—
—
—
Ending balance (December 31) ........................................
7
5
1
Additional losses included in earnings due to
reclassifications from other comprehensive income for:
Securities sold during the period ended December 31 .
—
(2
)
—
Securities still held at December 31 ..............................
—
—
(6
)
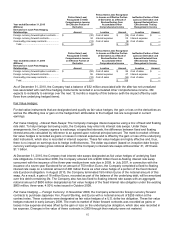
In addition, the plan assets of 3M’s pension and postretirement benefit plans are measured at fair value on a
recurring basis (at least annually). Refer to Note 11.
Assets and Liabilities that are Measured at Fair Value on a Nonrecurring Basis:
Disclosures are required for certain assets and liabilities that are measured at fair value, but are recognized and
disclosed at fair value on a nonrecurring basis in periods subsequent to initial recognition. During 2010 and 2009,
such measurements of fair value related primarily to long-lived asset impairments in 2009.
The following table provides information by level for assets and liabilities that were measured at fair value on a
nonrecurring basis. This table provides the fair value and amount of long-lived asset impairments for the periods
indicated. Refer to Note 1 (“Property, plant and equipment” and “Intangible Assets”) for further discussion of
accounting policies related to long-lived asset impairments.