3M 2010 Annual Report Download - page 19
Download and view the complete annual report
Please find page 19 of the 2010 3M annual report below. You can navigate through the pages in the report by either clicking on the pages listed below, or by using the keyword search tool below to find specific information within the annual report.-
 1
1 -
2
-
3
-
4
-
5
-
6
-
7
-
8
-
 9
9 -
 10
10 -
 11
11 -
 12
12 -
 13
13 -
 14
14 -
 15
15 -
 16
16 -
 17
17 -
 18
18 -
 19
19 -
 20
20 -
 21
21 -
 22
22 -
 23
23 -
 24
24 -
 25
25 -
 26
26 -
 27
27 -
 28
28 -
 29
29 -
30
-
31
-
32
-
33
-
34
-
35
-
36
-
37
-
38
-
39
-
40
-
41
-
42
-
43
-
44
-
45
-
46
-
47
-
48
-
49
-
50
-
51
-
52
-
53
-
54
-
55
-
56
-
57
-
58
-
59
-
60
-
61
-
62
-
63
-
64
-
65
-
66
-
67
-
68
-
69
-
70
-
71
-
72
-
73
-
74
-
75
-
76
-
77
-
78
-
79
-
80
-
81
-
82
-
83
-
84
-
85
-
86
-
87
-
88
-
89
-
90
-
91
-
92
-
93
-
94
-
95
-
96
-
97
-
98
-
99
-
100
-
101
-
102
-
103
-
104
-
105
-
106
-
107
-
108
-
109
-
110
-
111
-
112
-
113
-
114
-
115
-
116
-
117
-
118
-
119
-
120
-
121
-
122
-
123
-
124
-
125
-
126
-
127
-
128
-
129
-
130
-
131
-
132
 |
 |

13
Item 7. Management’s Discussion and Analysis of Financial Condition and Results of Operations.
Management’s Discussion and Analysis of Financial Condition and Results of Operations (MD&A) is designed to
provide a reader of 3M’s financial statements with a narrative from the perspective of management. 3M’s MD&A is
presented in eight sections:
x Overview
x Results of Operations
x Performance by Business Segment
x Performance by Geographic Area
x Critical Accounting Estimates
x New Accounting Pronouncements
x Financial Condition and Liquidity
x Financial Instruments
OVERVIEW
3M is a diversified global manufacturer, technology innovator and marketer of a wide variety of products. As
discussed in Note 17 to the Consolidated Financial Statements, effective in the first quarter of 2010, 3M made certain
product moves between its business segments in its continuing effort to drive growth by aligning businesses around
markets and customers. The financial information presented herein reflects the impact of these changes for all
periods presented. 3M manages its operations in six operating business segments: Industrial and Transportation;
Health Care; Display and Graphics; Consumer and Office; Safety, Security and Protection Services; and Electro and
Communications.
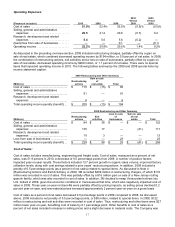
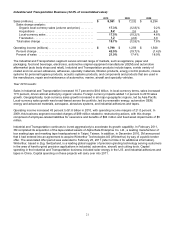
Fourth-quarter 2010 sales grew nearly 10 percent to $6.7 billion, despite negative comparisons from H1N1 and
moderating sales growth in optical films for LCD TVs. Sales growth was broad-based, with organic sales volumes
expanding in all businesses, led by a 19.8 percent increase in Electro and Communications and a 14.7 percent
increase in Display and Graphics. Geographically, organic sales volume was strongest in Asia Pacific at 18.1 percent
and Latin America at 12.2 percent. Net income attributable to 3M in the fourth quarter of 2010 was $928 million, or
$1.28 per diluted shares, compared to $935 million, or $1.30 per diluted share, in the fourth quarter of 2009. Fourth-
quarter income was penalized by year-on-year H1N1-related comparisons, increases in raw material costs, and
investments to accelerate future growth. 3M continues to invest in research and development, sales and marketing
(including advertising and merchandising investments), and also incurred acquisition-related costs in the fourth
quarter. 3M made several large fourth-quarter 2010 acquisitions, including Arizant Inc., Attenti Holdings S.A. and
Cogent Inc.
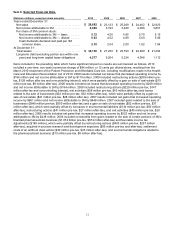
For total year 2010, 3M achieved record net sales and diluted earnings per share, while investing significantly to
improve long-term growth. For example, research, development and related expenses of $1.4 billion helped to drive
innovation and new product sales. 3M also accelerated sales and marketing investments in high-growth markets to
help secure future growth. The Company posted 2010 sales of $26.7 billion and earnings of $5.63 per diluted share,
up 15.3 percent and 24.6 percent, respectively. All businesses posted positive organic volume growth, led by Electro
and Communications at 26.9 percent, Display and Graphics at 26.5 percent, and Industrial and Transportation at
16.9 percent. Including special items (discussed below), net income attributable to 3M in 2010 was $4.085 billion, or
$5.63 per diluted share, compared to $3.193 billion or $4.52 per diluted share, in 2009, and $3.460 billion, or $4.89
per diluted share, in 2008.
In 2010, 3M recorded a one-time, non-cash income tax charge of $84 million, or 12 cents per diluted share, resulting
from the March 2010 enactment of the Patient Protection and Affordable Care Act, including modifications made in
the Health Care and Education Reconciliation Act of 2010. Refer to the special items discussion at the end of this
overview section for more detail.
3M has been aggressively restructuring the company since early 2008 and continued this effort through the third
quarter of 2009, with these restructuring actions and exit activities resulting in an aggregate reduction of
approximately 6,400 positions. The related net restructuring charges and other special items reduced net income
attributable to 3M for year 2009 by $119 million, or $0.17 per diluted share. Special items reduced net income
attributable to 3M for year 2008 by $194 million, or $0.28 per diluted share. Refer to the special items discussion at
the end of this overview section for more detail. These restructuring actions and exit activities resulted in savings of
almost $400 million in 2009 and additional incremental savings of more than $150 million in 2010, with the majority of
2010’s benefit in the first half of the year. In addition, 3M amended its policy regarding banked vacation in 2009,
which added more than $100 million to operating income in 2009, with a benefit of approximately $80 million in 2010.