3M 2010 Annual Report Download - page 43
Download and view the complete annual report
Please find page 43 of the 2010 3M annual report below. You can navigate through the pages in the report by either clicking on the pages listed below, or by using the keyword search tool below to find specific information within the annual report.-
 1
1 -
2
-
3
-
4
-
5
-
6
-
7
-
8
-
9
-
10
-
11
-
12
-
13
-
14
-
15
-
16
-
17
-
18
-
19
-
20
-
21
-
22
-
23
-
24
-
25
-
26
-
27
-
28
-
29
-
30
-
31
-
32
-
 33
33 -
 34
34 -
 35
35 -
 36
36 -
 37
37 -
 38
38 -
 39
39 -
 40
40 -
 41
41 -
 42
42 -
 43
43 -
 44
44 -
 45
45 -
 46
46 -
 47
47 -
 48
48 -
 49
49 -
 50
50 -
 51
51 -
 52
52 -
 53
53 -
54
-
55
-
56
-
57
-
58
-
59
-
60
-
61
-
62
-
63
-
64
-
65
-
66
-
67
-
68
-
69
-
70
-
71
-
72
-
73
-
74
-
75
-
76
-
77
-
78
-
79
-
80
-
81
-
82
-
83
-
84
-
85
-
86
-
87
-
88
-
89
-
90
-
91
-
92
-
93
-
94
-
95
-
96
-
97
-
98
-
99
-
100
-
101
-
102
-
103
-
104
-
105
-
106
-
107
-
108
-
109
-
110
-
111
-
112
-
113
-
114
-
115
-
116
-
117
-
118
-
119
-
120
-
121
-
122
-
123
-
124
-
125
-
126
-
127
-
128
-
129
-
130
-
131
-
132
 |
 |

37
upon a spread to a related maturity treasury bond. The spread against the treasury bond is reflective of the credit risk
of the issuer and the underlying collateral on the original issue date. 3M does not currently expect risk related to its
holdings in asset-backed securities to materially impact its financial condition or liquidity. Refer to Note 9 for more
details about 3M’s diversified marketable securities portfolio, which totaled $1.641 billion as of December 31, 2010.
Additional purchases of investments include additional survivor benefit insurance and equity investments.
As discussed in Notes 6 and 10, during the quarter ended March 31, 2010, the Company’s majority owned Sumitomo
3M Limited entity (Sumitomo 3M) purchased a portion of its shares held by its noncontrolling interest, Sumitomo
Electric Industries, Ltd. (SEI), by paying cash of 5.8 billion Japanese Yen and entering into a note payable to SEI of
17.4 billion Japanese Yen (approximately $63 million and $188 million, respectively, based on applicable exchange
rates at that time). The cash paid of approximately $63 million during the quarter ended March 31, 2010 as a result of
the purchase of Sumitomo 3M shares from SEI is classified as “Other investing activities” in the consolidated
statement of cash flows. The remainder of the purchase financed by the note payable to SEI is considered non-cash
investing and financing activity in the first quarter of 2010. As discussed in Note 10, during the second quarter of
2010, 3M recorded a financed liability of 1.7 billion Japanese yen (approximately $18 million based on applicable
exchange rates at that time), which is also considered a non-cash investing and financing activity.
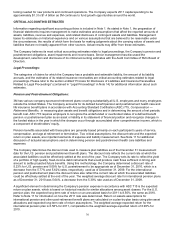
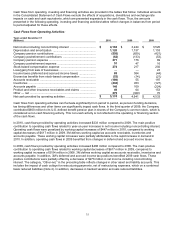
Cash Flows from Financing Activities:
Years ended December 31
(Millions)
2010
2009
2008
Change in short-term debt — net ..................................................
$
(24
)
$
(536
)
$
361
Repayment of debt (maturities greater than 90 days) ...................
(556
)
(519
)
(1,080
)
Proceeds from debt (maturities greater than 90 days) ..................
108
41
1,756
Total cash change in debt .............................................................
$
(472
)
$
(1,014
)
$
1,037
Purchases of treasury stock ..........................................................
(854
)
(17
)
(1,631
)
Reissuances of treasury stock ......................................................
666
431
289
Dividends paid to shareholders .....................................................
(1,500
)
(1,431
)
(1,398
)
Excess tax benefits from stock-based compensation ...................
53
14
21
Distributions to noncontrolling interests and other — net .............
(14
)
3
(84
)
Net cash used in financing activities .............................................
$
(2,121
)
$
(2,014
)
$
(1,766
)
Total debt at December 31, 2010 was $5.5 billion, compared to $5.7 billion at year-end 2009 and $6.7 billion at year-
end 2008. Debt was higher at year-end 2008 as the result of a strategy to build and maintain a cash buffer in the U.S.
given the difficult market environment at that point in time. Total debt was 25 percent of total capital (total capital is
defined as debt plus equity) at year-end 2010, compared with 30 percent at year-end 2009, and 39 percent at year-
end 2008. The net change in short-term debt is typically due to commercial paper activity. In 2010, major items in
repayment of debt (maturities greater than 90 days) included repayment of $350 million in Dealer Remarketable
Securities, which matured in December 2010, and repayment of a portion of debt related to the 5.8 billion Japanese
Yen installment paid on September 30, 2010 (refer to Notes 6 and 10 for more detail). In addition, approximately
$105 million in acquired debt related to 2010 acquisitions was subsequently repaid. In 2009, repayment of debt
(maturities greater than 90 days) includes a $400 million medium-term note that matured in November 2009 and also
includes repayments of commercial paper. In 2008, the repayment of debt for maturities greater than 90 days
primarily represents debt acquired upon the acquisition of Aearo that was immediately repaid and repayment of
commercial paper with maturities greater than 90 days. In 2010, proceeds from debt primarily include a 100.5 million
Canadian Dollar loan. In 2008, proceeds from debt primarily include a five-year, $850 million, fixed rate note issued
in August 2008 with a coupon rate of 4.375%, and a three-year, $800 million, fixed rate note issued in October 2008
with a coupon rate of 4.5% (refer to Note 10 for more information).
Repurchases of common stock are made to support the Company’s stock-based employee compensation plans and
for other corporate purposes. In February 2011, 3M’s Board of Directors authorized the repurchase of up to $7.0
billion of 3M’s outstanding common stock, replacing the Company’s existing repurchase program. This authorization
has no pre-established end date. In 2010, the Company purchased $854 million in shares, while in 2009 purchases
were minimal as the Company had no broker purchases of treasury stock. In 2008, the Company purchased $1.6
billion in shares. For more information, refer to the table titled “Issuer Purchases of Equity Securities” in Part II, Item
5.
Cash dividends paid to shareholders totaled $1.5 billion ($2.10 per share) in 2010, $1.431 billion ($2.04 per share) in
2009 and $1.398 billion ($2.00 per share) in 2008. 3M has paid dividends since 1916. In February 2011, the Board of
Directors increased the quarterly dividend on 3M common stock by 4.8 percent to 55 cents per share, equivalent to