3M 2010 Annual Report Download - page 30
Download and view the complete annual report
Please find page 30 of the 2010 3M annual report below. You can navigate through the pages in the report by either clicking on the pages listed below, or by using the keyword search tool below to find specific information within the annual report.-
 1
1 -
2
-
3
-
4
-
5
-
6
-
7
-
8
-
9
-
10
-
11
-
12
-
13
-
14
-
15
-
16
-
17
-
18
-
19
-
 20
20 -
 21
21 -
 22
22 -
 23
23 -
 24
24 -
 25
25 -
 26
26 -
 27
27 -
 28
28 -
 29
29 -
 30
30 -
 31
31 -
 32
32 -
 33
33 -
 34
34 -
 35
35 -
 36
36 -
 37
37 -
 38
38 -
 39
39 -
 40
40 -
41
-
42
-
43
-
44
-
45
-
46
-
47
-
48
-
49
-
50
-
51
-
52
-
53
-
54
-
55
-
56
-
57
-
58
-
59
-
60
-
61
-
62
-
63
-
64
-
65
-
66
-
67
-
68
-
69
-
70
-
71
-
72
-
73
-
74
-
75
-
76
-
77
-
78
-
79
-
80
-
81
-
82
-
83
-
84
-
85
-
86
-
87
-
88
-
89
-
90
-
91
-
92
-
93
-
94
-
95
-
96
-
97
-
98
-
99
-
100
-
101
-
102
-
103
-
104
-
105
-
106
-
107
-
108
-
109
-
110
-
111
-
112
-
113
-
114
-
115
-
116
-
117
-
118
-
119
-
120
-
121
-
122
-
123
-
124
-
125
-
126
-
127
-
128
-
129
-
130
-
131
-
132
 |
 |

24
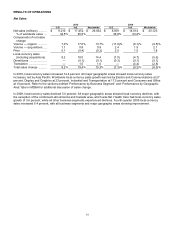
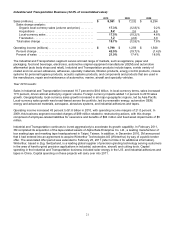
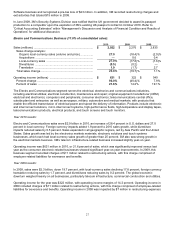
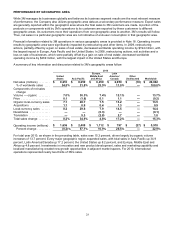
Display and Graphics Business (14.6% of consolidated sales):
2010
2009
2008
Sales (millions) ...........................................................................
$
3,884
$
3,132
$
3,268
Sales change analysis:
Organic local-currency sales (volume and price) ................
23.0
(5.6
)%
(18.0
)%
Acquisitions .........................................................................
—
2.8
0.1
Local-currency sales ...........................................................
23.0
%
(2.8
)%
(17.9
)%
Divestitures .........................................................................
—
—
(0.3
)
Translation ..........................................................................
1.0
(1.4
)
1.6
Total sales change ..................................................................
24.0
%
(4.2
)%
(16.6
)%
Operating income (millions) .......................................................
$
946
$
590
$
583
Percent change .......................................................................
60.3
%
1.3
%
(50.0
)%
Percent of sales ......................................................................
24.4
%
18.8
%
17.8
%
The Display and Graphics segment serves markets that include electronic display, traffic safety and commercial
graphics. This segment includes optical film solutions for LCD electronic displays; computer screen filters; reflective
sheeting for transportation safety; commercial graphics sheeting and systems; and mobile interactive solutions,
including mobile display technology, visual systems products, and computer privacy filters. The optical film business
provides films that serve numerous market segments of the electronic display industry. 3M provides distinct products
for five market segments, including products for: 1) LCD computer monitors 2) LCD televisions 3) handheld devices
such as cellular phones 4) notebook PCs and 5) automotive displays. The optical business includes a number of
different products that are protected by various patents and groups of patents. These patents provide varying levels
of exclusivity to 3M for a number of such products. As some of 3M’s optical film patents begin to expire in the next
few years, 3M will likely see more competition in these products. 3M continues to innovate in the area of optical films
and files patents on its new technology and products. 3M’s proprietary manufacturing technology and know-how also
provide a competitive advantage to 3M independent of its patents.
Year 2010 results:
Sales in Display and Graphics were $3.9 billion, up 24.0 percent year-on-year. Sales increased 23.0 percent in local
currencies, which was entirely organic. Foreign currency impacts increased sales growth by 1.0 percent. Sales rose
in all businesses, with the strongest growth in 3M’s optical systems and commercial graphics businesses. In the
fourth quarter of 2010, while sales growth moderated in optical films for LCD TVs, local-currency sales were still up
more than 10 percent year-on-year. Sales in 2010 were up slightly in the traffic safety systems business and mobile
interactive solutions division, which focuses on products that improve projection, personalization and privacy for
mobile device users. Geographically, sales growth was led by Asia Pacific, Latin America/Canada, and the United
States.
Operating income in 2010 totaled $946 million, or 24.4 percent of sales. In 2009, this business segment recorded net
charges of $22 million related to restructuring actions, with this charge comprised of employee-related liabilities for
severance and benefits and fixed asset impairments.
Year 2009 results:
In 2009, sales in Display and Graphics declined 4 percent to $3.1 billion, and operating income increased 1.3 percent
to $590 million. Sales grew in traffic safety systems and optical systems, but declined in commercial graphics as the
global recession significantly slowed spending on corporate advertising.
In 2009, operating income margins were 18.8 percent, negatively impacted by 0.8 percentage points due to net
restructuring charges of $22 million. This net aggregate charge included fixed asset impairments of $13 million and
employee-related severance/benefits/other of $9 million, which is recorded net of adjustments to previously recorded
restructuring charges. In 2008, restructuring charges and exit activities reduced operating income by $42 million.
These expenses were comprised of severance/related benefits and asset impairments.