3M 2010 Annual Report Download - page 33
Download and view the complete annual report
Please find page 33 of the 2010 3M annual report below. You can navigate through the pages in the report by either clicking on the pages listed below, or by using the keyword search tool below to find specific information within the annual report.-
 1
1 -
2
-
3
-
4
-
5
-
6
-
7
-
8
-
9
-
10
-
11
-
12
-
13
-
14
-
15
-
16
-
17
-
18
-
19
-
20
-
21
-
22
-
 23
23 -
 24
24 -
 25
25 -
 26
26 -
 27
27 -
 28
28 -
 29
29 -
 30
30 -
 31
31 -
 32
32 -
 33
33 -
 34
34 -
 35
35 -
 36
36 -
 37
37 -
 38
38 -
 39
39 -
 40
40 -
 41
41 -
 42
42 -
 43
43 -
44
-
45
-
46
-
47
-
48
-
49
-
50
-
51
-
52
-
53
-
54
-
55
-
56
-
57
-
58
-
59
-
60
-
61
-
62
-
63
-
64
-
65
-
66
-
67
-
68
-
69
-
70
-
71
-
72
-
73
-
74
-
75
-
76
-
77
-
78
-
79
-
80
-
81
-
82
-
83
-
84
-
85
-
86
-
87
-
88
-
89
-
90
-
91
-
92
-
93
-
94
-
95
-
96
-
97
-
98
-
99
-
100
-
101
-
102
-
103
-
104
-
105
-
106
-
107
-
108
-
109
-
110
-
111
-
112
-
113
-
114
-
115
-
116
-
117
-
118
-
119
-
120
-
121
-
122
-
123
-
124
-
125
-
126
-
127
-
128
-
129
-
130
-
131
-
132
 |
 |

27
Software business and recognized a pre-tax loss of $23 million. In addition, 3M recorded restructuring charges and
exit activities that totaled $15 million in 2008.
In June 2009, 3M’s Security Systems Division was notified that the UK government decided to award its passport
production to a competitor upon the expiration of 3M’s existing UK passport contract in October 2010. Refer to
“Critical Accounting Estimates” within “Management’s Discussion and Analysis of Financial Condition and Results of
Operations” for additional discussion.
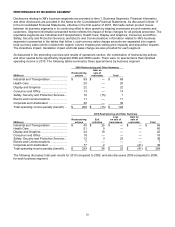
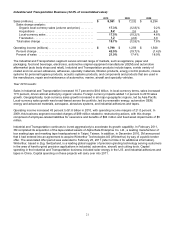
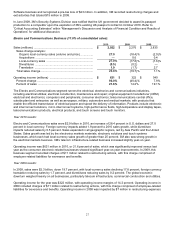
Electro and Communications Business (11.0% of consolidated sales):
2010
2009
2008
Sales (millions) ...........................................................................
$
2,922
$
2,276
$
2,835
Sales change analysis:
Organic local-currency sales (volume and price) ................
27.0
(18.4
)%
(2.0
)%
Acquisitions .........................................................................
—
0.6
0.4
Local-currency sales ...........................................................
27.0
%
(17.8
)%
(1.6
)%
Divestitures .........................................................................
(0.5
)
(0.2
)
—
Translation ..........................................................................
1.9
(1.7
)
2.7
Total sales change ..................................................................
28.4
%
(19.7
)%
1.1
%
Operating income (millions) .......................................................
$
631
$
322
$
540
Percent change .......................................................................
96.0
%
(40.4
)%
7.9
%
Percent of sales ......................................................................
21.6
%
14.2
%
19.1
%
The Electro and Communications segment serves the electrical, electronics and communications industries,
including electrical utilities; electrical construction, maintenance and repair; original equipment manufacturer (OEM)
electrical and electronics; computers and peripherals; consumer electronics; telecommunications central office,
outside plant and enterprise; as well as aerospace, military, automotive and medical markets; with products that
enable the efficient transmission of electrical power and speed the delivery of information. Products include electronic
and interconnect solutions, micro interconnect systems, high-performance fluids, high-temperature and display tapes,
telecommunications products, electrical products, and touch screens and touch monitors.
Year 2010 results:
Electro and Communications sales were $2.9 billion in 2010, an increase of 28.4 percent in U.S. dollars and 27.0
percent in local currency. Foreign currency impacts added 1.9 percent to 2010 sales growth, while divestiture
impacts reduced sales by 0.5 percent. Sales expanded in all geographic regions, led by Asia Pacific and the United
States. Sales growth was led by the electronics markets materials, electronic solutions and touch systems
businesses, which each had local-currency sales growth of greater than 25 percent. 3M also saw strong growth in
the electrical markets business. 3M’s telecom infrastructure-related business increased slightly year-on-year.
Operating income was $631 million in 2010, or 21.6 percent of sales, which was significantly improved versus last
year as the consumer electronic-related businesses showed significant year-on-year improvements. In 2009, this
business segment recorded charges of $11 million related to restructuring actions, with this charge comprised of
employee-related liabilities for severance and benefits.
Year 2009 results:
In 2009, sales were $2.3 billion, down 19.7 percent, with local-currency sales declining 17.8 percent, foreign currency
translation reducing sales by 1.7 percent, and divestitures reducing sales by 0.2 percent. The global economic
downturn weighed heavily on all businesses, particularly telecom infrastructure, commercial construction and utilities.
Operating income for the year was $322 million, with operating income margins of 14.2 percent. Operating income in
2009 included charges of $11 million related to restructuring actions, with this charge comprised of employee-related
liabilities for severance and benefits. Operating income in 2008 was impacted by $7 million in restructuring expenses.