3M 2010 Annual Report Download - page 121
Download and view the complete annual report
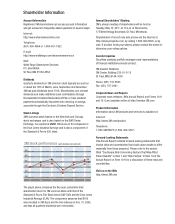
Please find page 121 of the 2010 3M annual report below. You can navigate through the pages in the report by either clicking on the pages listed below, or by using the keyword search tool below to find specific information within the annual report.-
 1
1 -
2
-
3
-
4
-
5
-
6
-
7
-
8
-
9
-
10
-
11
-
12
-
13
-
14
-
15
-
16
-
17
-
18
-
19
-
20
-
21
-
22
-
23
-
24
-
25
-
26
-
27
-
28
-
29
-
30
-
31
-
32
-
33
-
34
-
35
-
36
-
37
-
38
-
39
-
40
-
41
-
42
-
43
-
44
-
45
-
46
-
47
-
48
-
49
-
50
-
51
-
52
-
53
-
54
-
55
-
56
-
57
-
58
-
59
-
60
-
61
-
62
-
63
-
64
-
65
-
66
-
67
-
68
-
69
-
70
-
71
-
72
-
73
-
74
-
75
-
76
-
77
-
78
-
79
-
80
-
81
-
82
-
83
-
84
-
85
-
86
-
87
-
88
-
89
-
90
-
91
-
92
-
93
-
94
-
95
-
96
-
97
-
98
-
99
-
100
-
101
-
102
-
103
-
104
-
105
-
106
-
107
-
108
-
109
-
110
-
 111
111 -
 112
112 -
 113
113 -
 114
114 -
 115
115 -
 116
116 -
 117
117 -
 118
118 -
 119
119 -
 120
120 -
 121
121 -
 122
122 -
 123
123 -
 124
124 -
 125
125 -
 126
126 -
 127
127 -
 128
128 -
 129
129 -
 130
130 -
 131
131 -
132
 |
 |

115
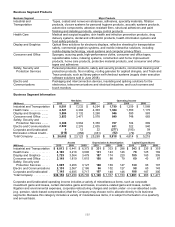
Business Segment Products
Business Segment
Major Products
Industrial and
Transportation
Tapes, coated and nonwoven abrasives, adhesives, specialty materials, filtration
products, closure systems for personal hygiene products, acoustic systems products,
automotive components, abrasion-resistant films, structural adhesives and paint
finishing and detailing products, energy control products
Health Care
Medical and surgical supplies, skin health and infection prevention products, drug
delivery systems, dental and orthodontic products, health information systems and
food safety products
Display and Graphics
Optical films solutions for electronic displays, reflective sheeting for transportation
safety, commercial graphics systems, and mobile interactive solutions, including
mobile display technology, visual systems and computer privacy filters
Consumer and Office
Sponges, scouring pads, high-performance cloths, consumer and office tapes,
repositionable notes, indexing systems, construction and home improvement
products, home care products, protective material products, and consumer and office
tapes and adhesives
Safety, Security and
Protection Services
Personal protection products, safety and security products, commercial cleaning and
protection products, floor matting, roofing granules for asphalt shingles, and Track and
Trace products, such as library patron self-checkout systems (supply chain execution
software solutions sold in June
2008)
Electro and
Communications
Packaging and interconnection devices, insulating and splicing solutions for the
electronics, telecommunications and electrical industries, and touch screens and
touch monitors
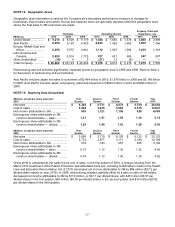
Business Segment Information
Net Sales
Operating Income
(Millions)
2010
2009
2008
2010
2009
2008
Industrial and Transportation
$
8,581
$
7,232
$
8,294
$
1,799
$
1,259
$
1,568
Health Care .......................
4,521
4,294
4,303
1,364
1,350
1,175
Display and Graphics ........
3,884
3,132
3,268
946
590
583
Consumer and Office ........
3,853
3,471
3,578
840
748
683
Safety, Security and
Protection Services ........
3,308
3,064
3,330
707
724
689
Electro and Communications
2,922
2,276
2,835
631
322
540
Corporate and Unallocated
(
(
Elimination of Dual Credit ..
(416
)
(358
)
(361
)
(92
)
(79
)
(79
)
Total Company ..................
$
26,662
$
23,123
$
25,269
$
5,918
$
4,814
$
5,218
Assets
Depreciation & Amortization
Capital Expenditures
(Millions)
2010
2009
2008
2010
2009
2008
2010
2009
2008
Industrial and Transportation
$
6,813
$
6,441
$
6,373
$
331
$
333
$
288
$
343
$
235
$
355
Health Care ..............
4,190
3,218
3,096
131
143
146
78
125
169
Display and Graphics ......
3,729
3,564
3,479
187
174
220
185
160
305
Consumer and Office ......
2,149
1,819
1,815
100
88
79
69
43
87
Safety, Security and
Protection Services ......
3,995
3,206
3,127
168
169
147
130
93
107
Electro and Communications
2,135
2,067
2,186
96
102
127
98
60
143
Corporate and Unallocated .
7,145
6,935
5,717
107
148
146
188
187
305
Total Company ...........
$
30,156
$
27,250
$
25,793
$
1,120
$
1,157
$
1,153
$
1,091
$
903
$
1,471
Corporate and Unallocated operating income includes a variety of miscellaneous items, such as corporate
investment gains and losses, certain derivative gains and losses, insurance-related gains and losses, certain
litigation and environmental expenses, corporate restructuring charges and certain under- or over-absorbed costs
(e.g. pension, stock-based compensation) that the Company may choose not to allocate directly to its business
segments. Because this category includes a variety of miscellaneous items, it is subject to fluctuation on a quarterly
and annual basis.
912 22 (277) (100) 59