3M 2010 Annual Report Download - page 118
Download and view the complete annual report
Please find page 118 of the 2010 3M annual report below. You can navigate through the pages in the report by either clicking on the pages listed below, or by using the keyword search tool below to find specific information within the annual report.-
 1
1 -
2
-
3
-
4
-
5
-
6
-
7
-
8
-
9
-
10
-
11
-
12
-
13
-
14
-
15
-
16
-
17
-
18
-
19
-
20
-
21
-
22
-
23
-
24
-
25
-
26
-
27
-
28
-
29
-
30
-
31
-
32
-
33
-
34
-
35
-
36
-
37
-
38
-
39
-
40
-
41
-
42
-
43
-
44
-
45
-
46
-
47
-
48
-
49
-
50
-
51
-
52
-
53
-
54
-
55
-
56
-
57
-
58
-
59
-
60
-
61
-
62
-
63
-
64
-
65
-
66
-
67
-
68
-
69
-
70
-
71
-
72
-
73
-
74
-
75
-
76
-
77
-
78
-
79
-
80
-
81
-
82
-
83
-
84
-
85
-
86
-
87
-
88
-
89
-
90
-
91
-
92
-
93
-
94
-
95
-
96
-
97
-
98
-
99
-
100
-
101
-
102
-
103
-
104
-
105
-
106
-
107
-
 108
108 -
 109
109 -
 110
110 -
 111
111 -
 112
112 -
 113
113 -
 114
114 -
 115
115 -
 116
116 -
 117
117 -
 118
118 -
 119
119 -
 120
120 -
 121
121 -
 122
122 -
 123
123 -
 124
124 -
 125
125 -
 126
126 -
 127
127 -
 128
128 -
129
-
130
-
131
-
132
 |
 |

112
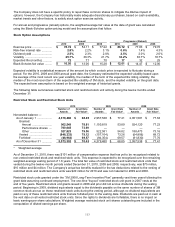
In addition to the annual grants, the Company makes other minor grants of stock options, restricted stock units and
other stock-based grants. The Company issues cash settled Restricted Stock Units and Stock Appreciation Rights in
certain countries. These grants do not result in the issuance of Common Stock and are considered immaterial by the
Company. There were approximately 13,524 participants with outstanding options, restricted stock, or restricted
stock units at December 31, 2010.
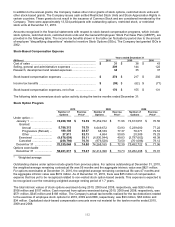
Amounts recognized in the financial statements with respect to stock-based compensation programs, which include
stock options, restricted stock, restricted stock units and the General Employees’ Stock Purchase Plan (GESPP), are
provided in the following table. The income tax benefits shown in the table can fluctuate by period due to the amount
of employee “disqualifying dispositions” related to Incentive Stock Options (ISOs). The Company last granted ISOs in
2002.
Stock-Based Compensation Expense
Years ended December 31
(Millions)
2010
2009
2008
Cost of sales ..................................................................................
$
31
$
38
$
43
Selling, general and administrative expenses ...............................
209
144
122
Research, development and related expenses .............................
34
35
37
Stock-based compensation expenses ..........................................
$
274
$
217
$
202
Income tax benefits .......................................................................
$
(98
)
$
(62
)
$
(71
)
Stock-based compensation expenses, net of tax .........................
$
176
$
155
$
131
The following table summarizes stock option activity during the twelve months ended December 31:
Stock Option Program
2010
2009
2008
Number of
Exercise
Number of
Exercise
Number of
Exercise
Options
Price*
Options
Price*
Options
Price*
Under option —
January 1 ............................
74,268,165
$
72.39
75,452,722
$
71.96
74,613,051
$
70.50
Granted:
Annual .........................
5,788,313
78.79
6,649,672
53.93
5,239,660
77.22
Progressive (Reload) ...
188,105
88.67
68,189
77.37
78,371
79.53
Other ............................
27,911
82.13
4,654
50.85
20,389
79.25
Exercised ........................
(9,678,654
)
59.11
(6,930,544
)
49.83
(3,797,663
)
49.38
Canceled .........................
(258,796
)
70.76
(976,528
)
73.50
(701,086
)
79.12
December 31 ......................
70,335,044
$
74.80
74,268,165
$
72.39
75,452,722
$
71.96
Options exercisable
December 31 ......................
58,201,617
$
75.87
62,414,398
$
73.73
63,282,408
$
70.01
* Weighted average
Outstanding shares under option include grants from previous plans. For options outstanding at December 31, 2010,
the weighted-average remaining contractual life was 56 months and the aggregate intrinsic value was $821 million.
For options exercisable at December 31, 2010, the weighted-average remaining contractual life was 47 months and
the aggregate intrinsic value was $619 million. As of December 31, 2010, there was $65 million of compensation
expense that has yet to be recognized related to non-vested stock option-based awards. This expense is expected to
be recognized over the remaining weighted-average vesting period of 1.7 years.
The total intrinsic values of stock options exercised during 2010, 2009 and 2008, respectively, was $263 million,
$108 million and $107 million. Cash received from options exercised during 2010, 2009 and 2008, respectively, was
$571 million, $345 million and $188 million. The Company’s actual tax benefits realized for the tax deductions related
to the exercise of employee stock options for 2010, 2009 and 2008, respectively, was $93 million, $38 million and
$34 million. Capitalized stock-based compensation amounts were not material for the twelve months ended 2010,
2009 and 2008.