3M 2010 Annual Report Download - page 119
Download and view the complete annual report
Please find page 119 of the 2010 3M annual report below. You can navigate through the pages in the report by either clicking on the pages listed below, or by using the keyword search tool below to find specific information within the annual report.-
 1
1 -
2
-
3
-
4
-
5
-
6
-
7
-
8
-
9
-
10
-
11
-
12
-
13
-
14
-
15
-
16
-
17
-
18
-
19
-
20
-
21
-
22
-
23
-
24
-
25
-
26
-
27
-
28
-
29
-
30
-
31
-
32
-
33
-
34
-
35
-
36
-
37
-
38
-
39
-
40
-
41
-
42
-
43
-
44
-
45
-
46
-
47
-
48
-
49
-
50
-
51
-
52
-
53
-
54
-
55
-
56
-
57
-
58
-
59
-
60
-
61
-
62
-
63
-
64
-
65
-
66
-
67
-
68
-
69
-
70
-
71
-
72
-
73
-
74
-
75
-
76
-
77
-
78
-
79
-
80
-
81
-
82
-
83
-
84
-
85
-
86
-
87
-
88
-
89
-
90
-
91
-
92
-
93
-
94
-
95
-
96
-
97
-
98
-
99
-
100
-
101
-
102
-
103
-
104
-
105
-
106
-
107
-
108
-
 109
109 -
 110
110 -
 111
111 -
 112
112 -
 113
113 -
 114
114 -
 115
115 -
 116
116 -
 117
117 -
 118
118 -
 119
119 -
 120
120 -
 121
121 -
 122
122 -
 123
123 -
 124
124 -
 125
125 -
 126
126 -
 127
127 -
 128
128 -
 129
129 -
130
-
131
-
132
 |
 |

113
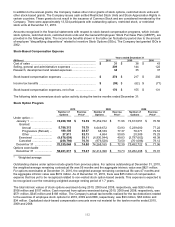
The Company does not have a specific policy to repurchase common shares to mitigate the dilutive impact of
options; however, the Company has historically made adequate discretionary purchases, based on cash availability,
market trends and other factors, to satisfy stock option exercise activity.
For annual and progressive (reload) options, the weighted average fair value at the date of grant was calculated
using the Black-Scholes option-pricing model and the assumptions that follow.
Stock Option Assumptions
Annual
Progressive (Reload)
2010
2009
2008
2010
2009
2008
Exercise price .........................
$
78.72
$
54.11
$
77.22
$
86.72
$
77.83
$
79.76
Risk-free interest rate .............
2.8
%
2.2
%
3.1
%
0.6
%
1.4
%
4.3
%
Dividend yield .........................
2.5
%
2.3
%
2.0
%
2.5
%
2.0
%
2.0
%
Volatility ..................................
25.7
%
30.3
%
21.7
%
33.2
%
30.7
%
18.7
%
Expected life (months) ............
72
71
70
17
32
25
Black-Scholes fair value .........
$
16.50
$
13.00
$
15.28
$
12.01
$
14.47
$
12.00
Expected volatility is a statistical measure of the amount by which a stock price is expected to fluctuate during a
period. For the 2010, 2009 and 2008 annual grant date, the Company estimated the expected volatility based upon
the average of the most recent one year volatility, the median of the term of the expected life rolling volatility, the
median of the most recent term of the expected life volatility of 3M stock, and the implied volatility on the grant date.
The expected term assumption is based on the weighted average of historical grants.
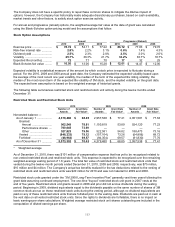
The following table summarizes restricted stock and restricted stock unit activity during the twelve months ended
December 31:
Restricted Stock and Restricted Stock Units
2010
2009
2008
Number of
Grant Date
Number of
Grant Date
Number of
Grant Date
Awards
Fair Value*
Awards
Fair Value*
Awards
Fair Value*
Nonvested balance —
As of January 1 ...................
4,379,480
$
68.85
2,957,538
$
77.41
2,001,581
$
77.63
Granted:
Annual .........................
902,549
78.81
1,150,819
53.89
924,120
77.23
Performance shares ....
760,645
73.99
—
—
—
—
Other ............................
527,823
79.56
522,581
54.82
188,473
73.16
Vested .............................
(948,233
)
79.12
(157,104
)
73.26
(64,806
)
68.72
Forfeited ..........................
(48,962
)
69.57
(94,354
)
69.57
(91,830
)
77.76
As of December 31 .............
5,573,302
$
70.43
4,379,480
$
68.85
2,957,538
$
77.41
* Weighted average
As of December 31, 2010, there was $101 million of compensation expense that has yet to be recognized related to
non-vested restricted stock and restricted stock units. This expense is expected to be recognized over the remaining
weighted-average vesting period of 1.8 years. The total fair value of restricted stock and restricted stock units that
vested during the twelve-month periods ended December 31, 2010, 2009 and 2008, respectively, was $75 million,
$10 million and $4 million. The Company’s actual tax benefits realized for the tax deductions related to the vesting of
restricted stock and restricted stock units was $20 million for 2010 and was not material for 2009 and 2008.
Restricted stock units granted under the “3M 2008 Long-Term Incentive Plan” generally vest three years following the
grant date assuming continued employment. The one-time “buyout” restricted stock unit grant in 2007 vests at the
end of five years. Restricted stock unit grants issued in 2008 and prior did not accrue dividends during the vesting
period. Beginning in 2009, dividend equivalents equal to the dividends payable on the same number of shares of 3M
common stock accrue on these restricted stock units during the vesting period, although no dividend equivalents are
paid on any of these restricted stock units that are forfeited prior to the vesting date. Dividends are paid out in cash at
the vest date on all vested restricted stock units. Since the rights to dividends are forfeitable, there is no impact on
basic earnings per share calculations. Weighted average restricted stock unit shares outstanding are included in the
computation of diluted earnings per share.