3M 2010 Annual Report Download - page 26
Download and view the complete annual report
Please find page 26 of the 2010 3M annual report below. You can navigate through the pages in the report by either clicking on the pages listed below, or by using the keyword search tool below to find specific information within the annual report.-
 1
1 -
2
-
3
-
4
-
5
-
6
-
7
-
8
-
9
-
10
-
11
-
12
-
13
-
14
-
15
-
 16
16 -
 17
17 -
 18
18 -
 19
19 -
 20
20 -
 21
21 -
 22
22 -
 23
23 -
 24
24 -
 25
25 -
 26
26 -
 27
27 -
 28
28 -
 29
29 -
 30
30 -
 31
31 -
 32
32 -
 33
33 -
 34
34 -
 35
35 -
 36
36 -
37
-
38
-
39
-
40
-
41
-
42
-
43
-
44
-
45
-
46
-
47
-
48
-
49
-
50
-
51
-
52
-
53
-
54
-
55
-
56
-
57
-
58
-
59
-
60
-
61
-
62
-
63
-
64
-
65
-
66
-
67
-
68
-
69
-
70
-
71
-
72
-
73
-
74
-
75
-
76
-
77
-
78
-
79
-
80
-
81
-
82
-
83
-
84
-
85
-
86
-
87
-
88
-
89
-
90
-
91
-
92
-
93
-
94
-
95
-
96
-
97
-
98
-
99
-
100
-
101
-
102
-
103
-
104
-
105
-
106
-
107
-
108
-
109
-
110
-
111
-
112
-
113
-
114
-
115
-
116
-
117
-
118
-
119
-
120
-
121
-
122
-
123
-
124
-
125
-
126
-
127
-
128
-
129
-
130
-
131
-
132
 |
 |

20
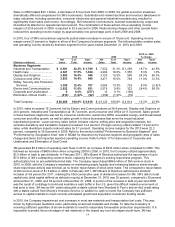
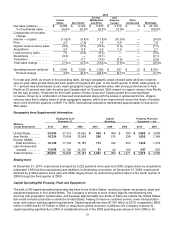
PERFORMANCE BY BUSINESS SEGMENT
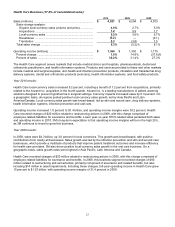
Disclosures relating to 3M’s business segments are provided in Item 1, Business Segments. Financial information
and other disclosures are provided in the Notes to the Consolidated Financial Statements. As discussed in Note 17
to the Consolidated Financial Statements, effective in the first quarter of 2010, 3M made certain product moves
between its business segments in its continuing effort to drive growth by aligning businesses around markets and
customers. Segment information presented herein reflects the impact of these changes for all periods presented. The
reportable segments are Industrial and Transportation; Health Care; Display and Graphics; Consumer and Office;
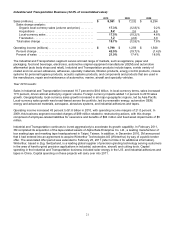
Safety, Security and Protection Services; and Electro and Communications. Information related to 3M’s business
segments is presented in the tables that follow. Local-currency sales change amounts are separated into organic
local-currency sales (which include both organic volume impacts plus selling price impacts) and acquisition impacts.
The divestiture impact, translation impact and total sales change are also provided for each segment.
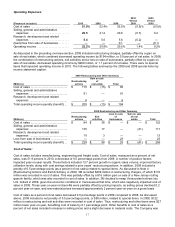
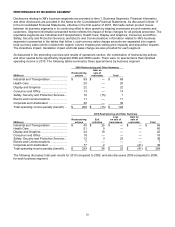
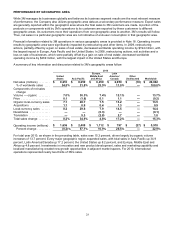
As discussed in the preceding overview and results of operations section, the combination of restructuring actions
and other special items significantly impacted 2009 and 2008 results. There were no special items that impacted
operating income in 2010. The following tables summarize these special items by business segment.
2009 Restructuring and Other Summary
(Millions)
Restructuring
actions
Gain on
sale of
real estate
Total
Industrial and Transportation ....................
$
89
$
—
$
89
Health Care ...............................................
20
—
20
Display and Graphics ................................
22
—
22
Consumer and Office ................................
13
—
13
Safety, Security and Protection Services ..
16
(15
)
1
Electro and Communications ....................
11
—
11
Corporate and Unallocated .......................
38
—
38
Total operating income penalty (benefit) ...
$
209
$
(15
)
$
194
2008 Restructuring and Other Summary
(Millions)
Restructuring
actions
Exit
activities
Loss
on sale of
businesses
Gain on
sale of
real estate
Total
Industrial and Transportation ....................
$
40
$
26
$
—
$
—
$
66
Health Care ...............................................
51
9
—
—
60
Display and Graphics ................................
24
18
—
—
42
Consumer and Office ................................
18
—
—
—
18
Safety, Security and Protection Services ..
12
3
23
—
38
Electro and Communications ....................
7
—
—
—
7
Corporate and Unallocated .......................
77
2
—
(41
)
38
Total operating income penalty (benefit) ...
$
229
$
58
$
23
$
(41
)
$
269
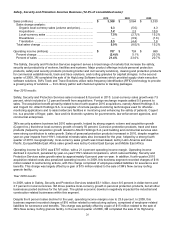
The following discusses total year results for 2010 compared to 2009, and also discusses 2009 compared to 2008,
for each business segment.