3M 2010 Annual Report Download - page 24
Download and view the complete annual report
Please find page 24 of the 2010 3M annual report below. You can navigate through the pages in the report by either clicking on the pages listed below, or by using the keyword search tool below to find specific information within the annual report.-
 1
1 -
2
-
3
-
4
-
5
-
6
-
7
-
8
-
9
-
10
-
11
-
12
-
13
-
 14
14 -
 15
15 -
 16
16 -
 17
17 -
 18
18 -
 19
19 -
 20
20 -
 21
21 -
 22
22 -
 23
23 -
 24
24 -
 25
25 -
 26
26 -
 27
27 -
 28
28 -
 29
29 -
 30
30 -
 31
31 -
 32
32 -
 33
33 -
 34
34 -
35
-
36
-
37
-
38
-
39
-
40
-
41
-
42
-
43
-
44
-
45
-
46
-
47
-
48
-
49
-
50
-
51
-
52
-
53
-
54
-
55
-
56
-
57
-
58
-
59
-
60
-
61
-
62
-
63
-
64
-
65
-
66
-
67
-
68
-
69
-
70
-
71
-
72
-
73
-
74
-
75
-
76
-
77
-
78
-
79
-
80
-
81
-
82
-
83
-
84
-
85
-
86
-
87
-
88
-
89
-
90
-
91
-
92
-
93
-
94
-
95
-
96
-
97
-
98
-
99
-
100
-
101
-
102
-
103
-
104
-
105
-
106
-
107
-
108
-
109
-
110
-
111
-
112
-
113
-
114
-
115
-
116
-
117
-
118
-
119
-
120
-
121
-
122
-
123
-
124
-
125
-
126
-
127
-
128
-
129
-
130
-
131
-
132
 |
 |

18
also able to mitigate organic volume declines through reductions in 3M’s manufacturing cost structure. Finally, in
response to deteriorating conditions in Venezuela, 3M Venezuela swapped bolivars into U.S. dollars in 2009. While
increasing cost of sales, these actions mitigated 3M’s exposure to future exchange rate risks.
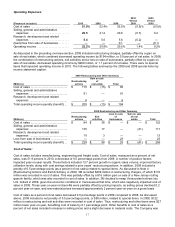
Selling, General and Administrative Expenses:
Selling, general and administrative (SG&A) expenses increased 12 percent in 2010 when compared to 2009. In
2010, sales and marketing expenses increased 14 percent, which included advertising and promotion investment
increases of over 20 percent in 2010. These increased investments are expected to help drive sales volumes, both
now and into the future. In addition, 3M has increased both sales coverage and its marketing strength, particularly in
faster-growing emerging economies. In 2010, general and administrative costs remained under control, as these
costs increased at approximately half the rate of 2010 sales growth. SG&A expenses, measured as a percent of net
sales, decreased 0.7 percentage points in 2010 compared to 2009. As indicated in Note 4, restructuring expenses of
$91 million were recorded in SG&A expenses in 2009. Measured as a percent of sales, these restructuring expenses
increased 2009 SG&A expenses by 0.4 percentage points.
Selling, general and administrative (SG&A) expenses as a percent of net sales increased 0.4 percentage points in
2009 when compared to 2008, but decreased $338 million in dollars, helped by savings from restructuring and other
actions. In the sales and marketing area, advertising and merchandising costs were down year-on-year, but were up
in the fourth quarter. As indicated above, restructuring expenses increased 2009 SG&A expenses as a percent of
sales by 0.4 percentage points. In 2008, restructuring actions and exit activities, net of a gain on sale of real estate,
increased SG&A by $111 million, which increased SG&A as a percent of sales by 0.5 percentage points. In the fourth
quarter of 2008, as part of its restructuring program, 3M took aggressive actions to reduce general and administrative
expenses and also pared back selling and marketing costs in certain businesses.
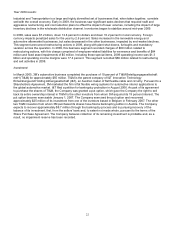
Research, Development and Related Expenses:
Research, development and related expenses (R&D) increased 11 percent in 2010 compared to 2009, as 3M
continued to support its key growth initiatives. R&D as a percent of net sales declined to 5.4 percent from 5.6 percent
in both 2009 and 2008. R&D expenses in dollars declined approximately 8 percent in 2009 compared to 2008.
Overall dollar spending in 2009 was impacted by company-wide cost initiatives, such as reductions in indirect
spending.
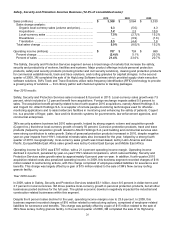
Gain/Loss from Sale of Businesses:
In June 2008, 3M completed the sale of HighJump Software to Battery Ventures, a technology venture capital and
private equity firm. 3M received proceeds of $85 million for this transaction and recognized, net of assets sold,
transaction and other costs, a pre-tax loss of $23 million (recorded in the Safety, Security and Protection Services
segment) in the second quarter of 2008.
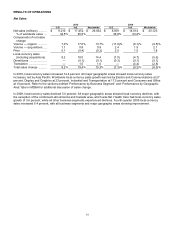
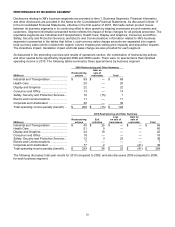
Operating Income:
3M uses operating income as one of its primary business segment performance measurement tools. Operating
income was 22.2 percent of sales in 2010, compared to 20.8 percent of sales in 2009 and 20.6 percent of sales in
2008. 2009 was negatively impacted by restructuring expenses, net of a gain on sale of real estate, which combined
decreased operating income by 0.9 percentage points ($194 million). 2008 was negatively impacted by restructuring
actions, exit activities and a loss on sale of businesses that were partially offset by a gain on sale of real estate,
which combined decreased operating income by 1.1 percentage points ($269 million).
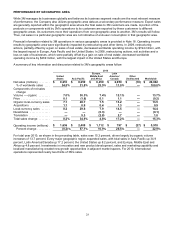
Interest Expense and Income:
(Millions)
2010
2009
2008
Interest expense ............................................................................
$
201
$
219
$
215
Interest income ..............................................................................
(38
)
(37
)
(105
)
Total ...........................................................................................
$
163
$
182
$
110
Interest Expense: Interest expense decreased in 2010, driven by lower average U.S. debt balances and lower
interest rates. Interest expense increased slightly in 2009, primarily due to higher average U.S. long-term debt
balances largely offset by benefits from reduced short-term balances and lower interest rates.