3M 2010 Annual Report Download - page 29
Download and view the complete annual report
Please find page 29 of the 2010 3M annual report below. You can navigate through the pages in the report by either clicking on the pages listed below, or by using the keyword search tool below to find specific information within the annual report.-
 1
1 -
2
-
3
-
4
-
5
-
6
-
7
-
8
-
9
-
10
-
11
-
12
-
13
-
14
-
15
-
16
-
17
-
18
-
 19
19 -
 20
20 -
 21
21 -
 22
22 -
 23
23 -
 24
24 -
 25
25 -
 26
26 -
 27
27 -
 28
28 -
 29
29 -
 30
30 -
 31
31 -
 32
32 -
 33
33 -
 34
34 -
 35
35 -
 36
36 -
 37
37 -
 38
38 -
 39
39 -
40
-
41
-
42
-
43
-
44
-
45
-
46
-
47
-
48
-
49
-
50
-
51
-
52
-
53
-
54
-
55
-
56
-
57
-
58
-
59
-
60
-
61
-
62
-
63
-
64
-
65
-
66
-
67
-
68
-
69
-
70
-
71
-
72
-
73
-
74
-
75
-
76
-
77
-
78
-
79
-
80
-
81
-
82
-
83
-
84
-
85
-
86
-
87
-
88
-
89
-
90
-
91
-
92
-
93
-
94
-
95
-
96
-
97
-
98
-
99
-
100
-
101
-
102
-
103
-
104
-
105
-
106
-
107
-
108
-
109
-
110
-
111
-
112
-
113
-
114
-
115
-
116
-
117
-
118
-
119
-
120
-
121
-
122
-
123
-
124
-
125
-
126
-
127
-
128
-
129
-
130
-
131
-
132
 |
 |

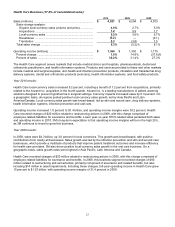
23
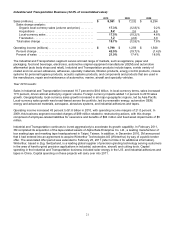
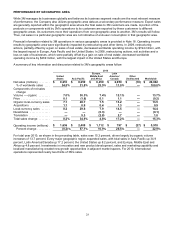
Health Care Business (17.0% of consolidated sales):
2010
2009
2008
Sales (millions) ...........................................................................
$
4,521
$
4,294
$
4,303
Sales change analysis:
Organic local-currency sales (volume and price) ................
4.0
%
2.7
%
5.0
%
Acquisitions .........................................................................
1.2
0.9
1.7
Local-currency sales ...........................................................
5.2
%
3.6
%
6.7
%
Divestitures .........................................................................
(0.2
)
—
(0.1
)
Translation ..........................................................................
0.3
(3.8
)
1.5
Total sales change ..................................................................
5.3
%
(0.2
)%
8.1
%
Operating income (millions) .......................................................
$
1,364
$
1,350
$
1,175
Percent change .......................................................................
1.0
%
14.9
%
(37.6
)%
Percent of sales ......................................................................
30.2
%
31.4
%
27.3
%
The Health Care segment serves markets that include medical clinics and hospitals, pharmaceuticals, dental and
orthodontic practitioners, and health information systems. Products and services provided to these and other markets
include medical and surgical supplies, skin health and infection prevention products, inhalation and transdermal drug
delivery systems, dental and orthodontic products (oral care), health information systems, and food safety products.
Year 2010 results:
Health Care local-currency sales increased 5.2 percent, including a benefit of 1.2 percent from acquisitions, primarily
related to the Arizant Inc. acquisition in the fourth quarter. Arizant Inc. is a leading manufacturer of patient warming
solutions designed to prevent hypothermia in surgical settings. Currency impacts increased sales by 0.3 percent. On
a geographic basis, all regions posted positive local-currency sales growth, led by Asia Pacific and Latin
America/Canada. Local currency sales growth was broad-based, led by skin and wound care, drug delivery systems,
health information systems, infection prevention and oral care.
Operating income increased 1.0 percent to $1.4 billion, and operating income margins were 30.2 percent. Health
Care recorded charges of $20 million related to restructuring actions in 2009, with this charge comprised of
employee-related liabilities for severance and benefits. Lower year-on-year H1N1-related sales penalized both sales
and operating income in 2010. 3M’s long-term expectation is that operating income margins will be in the high 20’s,
as 3M continues to invest to grow this business.
Year 2009 results:
In 2009, sales were $4.3 billion, up 3.6 percent in local currencies. This growth was broad-based, with positive
contributions from nearly all businesses. Sales growth was led by the infection prevention and skin and wound care
businesses, which provide a multitude of products that improve patient treatment outcomes and increase efficiency
for health care providers. 3M also drove positive local-currency sales growth in the oral care business. On a
geographic basis, sales growth rates were highest in Asia Pacific, Latin America and Canada.
Health Care recorded charges of $20 million related to restructuring actions in 2009, with this charge comprised of
employee-related liabilities for severance and benefits. In 2008, this business segment recorded charges of $60
million related to restructuring and exit activities, primarily comprised of severance and related benefits, but also
including $14 million in asset impairments. Including these charges, full-year operating income in Health Care grew
15 percent to $1.35 billion, with operating income margins of 31.4 percent in 2009.