3M 2010 Annual Report Download - page 3
Download and view the complete annual report
Please find page 3 of the 2010 3M annual report below. You can navigate through the pages in the report by either clicking on the pages listed below, or by using the keyword search tool below to find specific information within the annual report.-
 1
1 -
 2
2 -
 3
3 -
 4
4 -
 5
5 -
 6
6 -
 7
7 -
 8
8 -
 9
9 -
 10
10 -
 11
11 -
 12
12 -
 13
13 -
 14
14 -
15
-
16
-
17
-
18
-
19
-
20
-
21
-
22
-
23
-
24
-
25
-
26
-
27
-
28
-
29
-
30
-
31
-
32
-
33
-
34
-
35
-
36
-
37
-
38
-
39
-
40
-
41
-
42
-
43
-
44
-
45
-
46
-
47
-
48
-
49
-
50
-
51
-
52
-
53
-
54
-
55
-
56
-
57
-
58
-
59
-
60
-
61
-
62
-
63
-
64
-
65
-
66
-
67
-
68
-
69
-
70
-
71
-
72
-
73
-
74
-
75
-
76
-
77
-
78
-
79
-
80
-
81
-
82
-
83
-
84
-
85
-
86
-
87
-
88
-
89
-
90
-
91
-
92
-
93
-
94
-
95
-
96
-
97
-
98
-
99
-
100
-
101
-
102
-
103
-
104
-
105
-
106
-
107
-
108
-
109
-
110
-
111
-
112
-
113
-
114
-
115
-
116
-
117
-
118
-
119
-
120
-
121
-
122
-
123
-
124
-
125
-
126
-
127
-
128
-
129
-
130
-
131
-
132
 |
 |

$25
$20
$15
$10
$6.00
$4.00
$2.00
0
0
$2.00
$2.50
$1.50
$1.00
$30
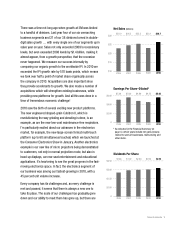
Net Sales (billions)
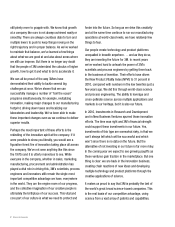
Earnings Per Share–Diluted*
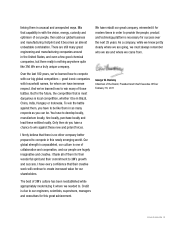
Dividends Per Share
* As indicated in the Financial Summary on
page 4, certain years include net gains (losses)
related to sales of businesses, restructuring and
other items.
2010
$2.10
20092006 2007 2008
$1.84 $1.92 $2.00 $2.04
2010
$5.63
2010
$26.7
2006 2007 2008 2009
$22.9 $24.5 $25.3 $23.1
2006 2007 2008
$5.06 $5.60 $4.89
2009
$4.52
Driven to Innovate 1
There was a time not long ago when growth at 3M was limited
to a handful of divisions. Last year four of our six overarching
business segments and 21 of our 38 divisions turned in double-
digit sales growth … with every single one of our segments up in
sales year on year. Sales not only exceeded 2009’s recessionary
levels, but even exceeded 2008 levels by $1.4 billion, making it
almost appear, from a growth perspective, that the recession
never happened. We measure our success internally by
comparing our organic growth to the worldwide IPI. In 2010 we
exceeded the IPI growth rate by 570 basis points, which means
we took over half a point of market share organically across
the company in 2010. Acquisitions are also important since
they provide accelerants to growth. We also made a number of
acquisitions which will strengthen existing businesses, while
providing new platforms for growth. And all this was done in a
time of tremendous economic challenge!
2010 saw the birth of several exciting new product platforms.
The new engineered shaped-grain Cubitron II, which is
revolutionizing the way grinding and abrading is done, is an
example as are the new low-cost maintenance-free respirators.
I’m particularly excited about our advances in the electronics
market, for example, the new large-screen format multi-touch
platform (up to 60 simultaneous touches) which we launched at
the Consumer Electronics Show in January. Another electronics
example is our new line of micro projectors being demonstrated
to customers, not only in normal projection mode, but also in
head-up displays, car rear-seat entertainment and educational
applications. It’s heartening to see the great progress in the fast-
moving electronics space. In fact, the electronics segment of
our business was among our fastest-growing in 2010, with a
percent unit volume increase.
Every company has its challenges and, as every challenge is
met and passed, it seems that there is always a new one to
take its place. The scale of our challenges has gradually gone
down and our ability to meet them has gone up, but there are
,
45