3M 2010 Annual Report Download - page 77
Download and view the complete annual report
Please find page 77 of the 2010 3M annual report below. You can navigate through the pages in the report by either clicking on the pages listed below, or by using the keyword search tool below to find specific information within the annual report.-
 1
1 -
2
-
3
-
4
-
5
-
6
-
7
-
8
-
9
-
10
-
11
-
12
-
13
-
14
-
15
-
16
-
17
-
18
-
19
-
20
-
21
-
22
-
23
-
24
-
25
-
26
-
27
-
28
-
29
-
30
-
31
-
32
-
33
-
34
-
35
-
36
-
37
-
38
-
39
-
40
-
41
-
42
-
43
-
44
-
45
-
46
-
47
-
48
-
49
-
50
-
51
-
52
-
53
-
54
-
55
-
56
-
57
-
58
-
59
-
60
-
61
-
62
-
63
-
64
-
65
-
66
-
 67
67 -
 68
68 -
 69
69 -
 70
70 -
 71
71 -
 72
72 -
 73
73 -
 74
74 -
 75
75 -
 76
76 -
 77
77 -
 78
78 -
 79
79 -
 80
80 -
 81
81 -
 82
82 -
 83
83 -
 84
84 -
 85
85 -
 86
86 -
 87
87 -
88
-
89
-
90
-
91
-
92
-
93
-
94
-
95
-
96
-
97
-
98
-
99
-
100
-
101
-
102
-
103
-
104
-
105
-
106
-
107
-
108
-
109
-
110
-
111
-
112
-
113
-
114
-
115
-
116
-
117
-
118
-
119
-
120
-
121
-
122
-
123
-
124
-
125
-
126
-
127
-
128
-
129
-
130
-
131
-
132
 |
 |

71
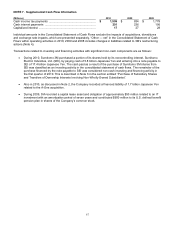
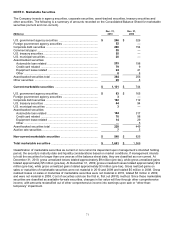
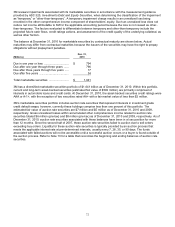
NOTE 9. Marketable Securities
The Company invests in agency securities, corporate securities, asset-backed securities, treasury securities and
other securities. The following is a summary of amounts recorded on the Consolidated Balance Sheet for marketable
securities (current and non-current).
Dec. 31,
Dec. 31,
(Millions)
2010
2009
U.S. government agency securities .................................................
$
246
$
326
Foreign government agency securities ............................................
52
—
Corporate debt securities .................................................................
280
154
Commercial paper .............................................................................
55
—
U.S. treasury securities .....................................................................
55
—
U.S. municipal securities ...................................................................
20
—
Asset-backed securities:
Automobile loan related ................................................................
253
198
Credit card related ........................................................................
79
9
Equipment lease related ...............................................................
24
41
Other .............................................................................................
8
8
Asset-backed securities total ...........................................................
364
256
Other securities ................................................................................
29
8
Current marketable securities ......................................................
$
1,101
$
744
U.S. government agency securities .................................................
$
63
$
165
Foreign government agency securities ............................................
3
—
Corporate debt securities .................................................................
192
112
U.S. treasury securities ....................................................................
44
94
U.S. municipal securities ..................................................................
3
—
Asset-backed securities:
Automobile loan related ................................................................
144
317
Credit card related ........................................................................
70
98
Equipment lease related ...............................................................
14
29
Other .............................................................................................
—
5
Asset-backed securities total ...........................................................
228
449
Auction rate securities ......................................................................
7
5
Non-current marketable securities ...............................................
$
540
$
825
Total marketable securities ...........................................................
$
1,641
$
1,569
Classification of marketable securities as current or non-current is dependent upon management’s intended holding
period, the security’s maturity date and liquidity considerations based on market conditions. If management intends
to hold the securities for longer than one year as of the balance sheet date, they are classified as non-current. At
December 31, 2010, gross unrealized losses totaled approximately $9 million (pre-tax), while gross unrealized gains
totaled approximately $5 million (pre-tax). At December 31, 2009, gross unrealized losses totaled approximately $12
million (pre-tax), while gross unrealized gains totaled approximately $3 million (pre-tax). Gross realized gains on
sales or maturities of marketable securities were not material in 2010 and 2009 and totaled $5 million in 2008. Gross
realized losses on sales or maturities of marketable securities were not material in 2010, totaled $3 million in 2009,
and were not material in 2008. Cost of securities sold use the first in, first out (FIFO) method. Since these marketable
securities are classified as available-for-sale securities, changes in fair value will flow through other comprehensive
income, with amounts reclassified out of other comprehensive income into earnings upon sale or “other-than-
temporary” impairment.