3M 2010 Annual Report Download - page 69
Download and view the complete annual report
Please find page 69 of the 2010 3M annual report below. You can navigate through the pages in the report by either clicking on the pages listed below, or by using the keyword search tool below to find specific information within the annual report.-
 1
1 -
2
-
3
-
4
-
5
-
6
-
7
-
8
-
9
-
10
-
11
-
12
-
13
-
14
-
15
-
16
-
17
-
18
-
19
-
20
-
21
-
22
-
23
-
24
-
25
-
26
-
27
-
28
-
29
-
30
-
31
-
32
-
33
-
34
-
35
-
36
-
37
-
38
-
39
-
40
-
41
-
42
-
43
-
44
-
45
-
46
-
47
-
48
-
49
-
50
-
51
-
52
-
53
-
54
-
55
-
56
-
57
-
58
-
 59
59 -
 60
60 -
 61
61 -
 62
62 -
 63
63 -
 64
64 -
 65
65 -
 66
66 -
 67
67 -
 68
68 -
 69
69 -
 70
70 -
 71
71 -
 72
72 -
 73
73 -
 74
74 -
 75
75 -
 76
76 -
 77
77 -
 78
78 -
 79
79 -
80
-
81
-
82
-
83
-
84
-
85
-
86
-
87
-
88
-
89
-
90
-
91
-
92
-
93
-
94
-
95
-
96
-
97
-
98
-
99
-
100
-
101
-
102
-
103
-
104
-
105
-
106
-
107
-
108
-
109
-
110
-
111
-
112
-
113
-
114
-
115
-
116
-
117
-
118
-
119
-
120
-
121
-
122
-
123
-
124
-
125
-
126
-
127
-
128
-
129
-
130
-
131
-
132
 |
 |

63
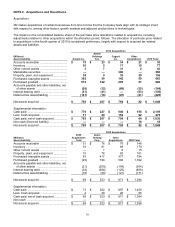
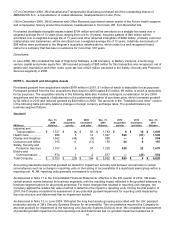
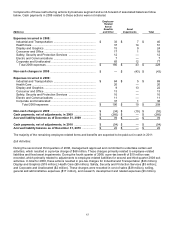
Components of these restructuring actions by business segment and a roll-forward of associated balances follow
below. Cash payments in 2008 related to these actions were not material.
(Millions)
Employee-
Related
Items/
Benefits
and Other
Asset
Impairments
Total
Expenses incurred in 2008:
Industrial and Transportation .....................................................
$
33
$
7
$
40
Health Care ................................................................................
37
14
51
Display and Graphics .................................................................
15
9
24
Consumer and Office .................................................................
17
1
18
Safety, Security and Protection Services ..................................
12
—
12
Electro and Communications .....................................................
7
—
7
Corporate and Unallocated ........................................................
65
12
77
Total 2008 expenses ..............................................................
$
186
$
43
$
229
Non-cash changes in 2008 .........................................................
$
—
$
(43
)
$
(43
)
Expenses incurred in 2009:
Industrial and Transportation .....................................................
$
84
$
5
$
89
Health Care ................................................................................
20
—
20
Display and Graphics .................................................................
9
13
22
Consumer and Office .................................................................
13
—
13
Safety, Security and Protection Services ..................................
16
—
16
Electro and Communications .....................................................
11
—
11
Corporate and Unallocated ........................................................
37
1
38
Total 2009 expenses ..........................................................
$
190
$
19
$
209
Non-cash changes in 2009 .........................................................
$
(34
)
$
(19
)
$
(53
)
Cash payments, net of adjustments, in 2009 ...........................
$
(266
)
$
—
$
(266
)
Accrued liability balance as of December 31, 2009 .................
$
76
$
—
$
76
Cash payments, net of adjustments, in 2010 ...........................
$
(54
)
$
—
$
(54
)
Accrued liability balance as of December 31, 2010 .................
$
22
$
—
$
22
The majority of the remaining employee related items and benefits are expected to be paid out in cash in 2011.
Exit Activities:
During the second and third quarters of 2008, management approved and committed to undertake certain exit
activities, which resulted in a pre-tax charge of $68 million. These charges primarily related to employee-related
liabilities and fixed asset impairments. During the fourth quarter of 2008, a pre-tax benefit of $10 million was
recorded, which primarily related to adjustments to employee-related liabilities for second and third-quarter 2008 exit
activities. In total for 2008, these actions resulted in pre-tax charges for Industrial and Transportation ($26 million);
Display and Graphics ($18 million); Health Care ($9 million); Safety, Security and Protection Services ($3 million);
and Corporate and Unallocated ($2 million). These charges were recorded in cost of sales ($38 million), selling,
general and administrative expenses ($17 million), and research, development and related expenses ($3 million).