3M 2010 Annual Report Download - page 62
Download and view the complete annual report
Please find page 62 of the 2010 3M annual report below. You can navigate through the pages in the report by either clicking on the pages listed below, or by using the keyword search tool below to find specific information within the annual report.-
 1
1 -
2
-
3
-
4
-
5
-
6
-
7
-
8
-
9
-
10
-
11
-
12
-
13
-
14
-
15
-
16
-
17
-
18
-
19
-
20
-
21
-
22
-
23
-
24
-
25
-
26
-
27
-
28
-
29
-
30
-
31
-
32
-
33
-
34
-
35
-
36
-
37
-
38
-
39
-
40
-
41
-
42
-
43
-
44
-
45
-
46
-
47
-
48
-
49
-
50
-
51
-
 52
52 -
 53
53 -
 54
54 -
 55
55 -
 56
56 -
 57
57 -
 58
58 -
 59
59 -
 60
60 -
 61
61 -
 62
62 -
 63
63 -
 64
64 -
 65
65 -
 66
66 -
 67
67 -
 68
68 -
 69
69 -
 70
70 -
 71
71 -
 72
72 -
73
-
74
-
75
-
76
-
77
-
78
-
79
-
80
-
81
-
82
-
83
-
84
-
85
-
86
-
87
-
88
-
89
-
90
-
91
-
92
-
93
-
94
-
95
-
96
-
97
-
98
-
99
-
100
-
101
-
102
-
103
-
104
-
105
-
106
-
107
-
108
-
109
-
110
-
111
-
112
-
113
-
114
-
115
-
116
-
117
-
118
-
119
-
120
-
121
-
122
-
123
-
124
-
125
-
126
-
127
-
128
-
129
-
130
-
131
-
132
 |
 |

56
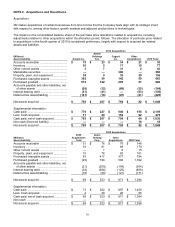
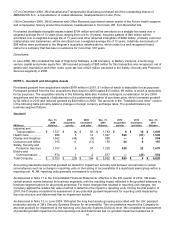
NOTE 2. Acquisitions and Divestitures
Acquisitions:
3M makes acquisitions of certain businesses from time to time that the Company feels align with its strategic intent
with respect to, among other factors, growth markets and adjacent product lines or technologies.
The impact on the consolidated balance sheet of the purchase price allocations related to acquisitions, including
adjustments relative to other acquisitions within the allocation period, follows. The allocation of purchase price related
to acquisitions in the fourth quarter of 2010 is considered preliminary, largely with respect to acquired tax-related
assets and liabilities.
2010 Acquisitions
(Millions)
Asset (Liability)
Arizant Inc.
Attenti
Holdings
S.A.
Cogent
Inc.
Other
Acquisitions
2010 Total
Accounts receivable ..................................
$
15
$
23
$
34
$
21
$
93
Inventory ....................................................
36
5
17
19
77
Other current assets ..................................
3
7
31
2
43
Marketable securities ................................
—
—
380
—
380
Property, plant, and equipment .................
38
9
30
29
106
Purchased intangible assets .....................
362
90
142
69
663
Purchased goodwill ...................................
512
122
295
51
980
Accounts payable and other liabilities, net
of other assets .......................................
(29
)
(12
)
(88
)
(35
)
(164
)
Interest bearing debt .................................
(31
)
(21
)
—
(53
)
(105
)
Deferred tax asset/(liability) .......................
(141
)
(16
)
(47
)
(21
)
(225
)
Net assets acquired ...................................
$
765
$
207
$
794
$
82
$
1,848
Supplemental information:
Cash paid ..................................................
$
776
$
227
$
946
$
156
$
2,105
Less: Cash acquired ..................................
11
20
152
92
275
Cash paid, net of cash acquired ................
$
765
$
207
$
794
$
64
$
1,830
Non-cash (financed liability) ......................
—
—
—
18
18
Net assets acquired ...................................
$
765
$
207
$
794
$
82
$
1,848
2008 Acquisitions
(Millions)
Asset (Liability)
2009
Acquisitions
Total
Aearo
Holding
Corp.
Other
Acquisitions
2008 Total
Accounts receivable ..................................
$
31
$
76
$
70
$
146
Inventory ....................................................
10
81
89
170
Other current assets ..................................
—
7
8
15
Property, plant, and equipment .................
15
78
83
161
Purchased intangible assets .....................
93
417
377
794
Purchased goodwill ...................................
(25
)
798
594
1,392
Accounts payable and other liabilities, net
of other assets .......................................
(21
)
(200
)
(104
)
(304
)
Interest bearing debt .................................
(18
)
(684
)
(125
)
(809
)
Deferred tax asset/(liability) .......................
(16
)
(50
)
(121
)
(171
)
Net assets acquired ...................................
$
69
$
523
$
871
$
1,394
Supplemental information:
Cash paid ..................................................
$
73
$
562
$
897
$
1,459
Less: Cash acquired ..................................
4
39
26
65
Cash paid, net of cash acquired ................
$
69
$
523
$
871
$
1,394
Non-cash ...................................................
—
—
—
—
Net assets acquired ...................................
$
69
$
523
$
871
$
1,394