Xcel Energy 2013 Annual Report Download - page 87
Download and view the complete annual report
Please find page 87 of the 2013 Xcel Energy annual report below. You can navigate through the pages in the report by either clicking on the pages listed below, or by using the keyword search tool below to find specific information within the annual report.-
 1
1 -
2
-
3
-
4
-
5
-
6
-
7
-
8
-
9
-
10
-
11
-
12
-
13
-
14
-
15
-
16
-
17
-
18
-
19
-
20
-
21
-
22
-
23
-
24
-
25
-
26
-
27
-
28
-
29
-
30
-
31
-
32
-
33
-
34
-
35
-
36
-
37
-
38
-
39
-
40
-
41
-
42
-
43
-
44
-
45
-
46
-
47
-
48
-
49
-
50
-
51
-
52
-
53
-
54
-
55
-
56
-
57
-
58
-
59
-
60
-
61
-
62
-
63
-
64
-
65
-
66
-
67
-
68
-
69
-
70
-
71
-
72
-
73
-
74
-
75
-
76
-
 77
77 -
 78
78 -
 79
79 -
 80
80 -
 81
81 -
 82
82 -
 83
83 -
 84
84 -
 85
85 -
 86
86 -
 87
87 -
 88
88 -
 89
89 -
 90
90 -
 91
91 -
 92
92 -
 93
93 -
 94
94 -
 95
95 -
 96
96 -
 97
97 -
98
-
99
-
100
-
101
-
102
-
103
-
104
-
105
-
106
-
107
-
108
-
109
-
110
-
111
-
112
-
113
-
114
-
115
-
116
-
117
-
118
-
119
-
120
-
121
-
122
-
123
-
124
-
125
-
126
-
127
-
128
-
129
-
130
-
131
-
132
-
133
-
134
-
135
-
136
-
137
-
138
-
139
-
140
-
141
-
142
-
143
-
144
-
145
-
146
-
147
-
148
-
149
-
150
-
151
-
152
-
153
-
154
-
155
-
156
-
157
-
158
-
159
-
160
-
161
-
162
-
163
-
164
-
165
-
166
-
167
-
168
-
169
-
170
-
171
-
172
-
173
-
174
-
175
-
176
-
177
-
178
-
179
-
180
 |
 |

69
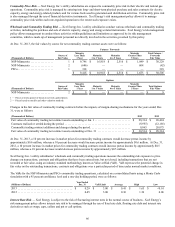
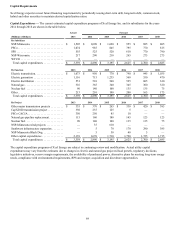
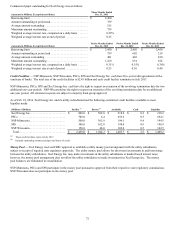
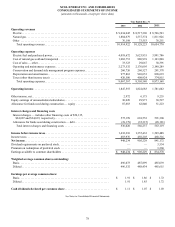
Capital Requirements
Xcel Energy expects to meet future financing requirements by periodically issuing short-term debt, long-term debt, common stock,
hybrid and other securities to maintain desired capitalization ratios.
Capital Expenditures — The current estimated capital expenditure programs of Xcel Energy Inc. and its subsidiaries for the years
2014 through 2018 are shown in the table below.
Actual Forecast
(Millions of Dollars) 2013 2014 2015 2016 2017 2018
By Subsidiary
NSP-Minnesota. . . . . . . . . . . . . . . . . . . . . . . . $ 1,505 $ 1,090 $ 1,620 $ 955 $ 885 $ 805
PSCo . . . . . . . . . . . . . . . . . . . . . . . . . . . . . . . . 1,074 985 845 795 770 815
SPS . . . . . . . . . . . . . . . . . . . . . . . . . . . . . . . . . 555 525 520 610 770 790
NSP-Wisconsin. . . . . . . . . . . . . . . . . . . . . . . . 217 290 210 265 275 275
WYCO . . . . . . . . . . . . . . . . . . . . . . . . . . . . . . 8 — — — — —
Total capital expenditures. . . . . . . . . . . . . . . $ 3,359 $ 2,890 $ 3,195 $ 2,625 $ 2,700 $ 2,685
By Function 2013 2014 2015 2016 2017 2018
Electric transmission. . . . . . . . . . . . . . . . . . . . $ 1,073 $ 950 $ 770 $ 790 $ 945 $ 1,035
Electric generation . . . . . . . . . . . . . . . . . . . . . 1,116 715 1,235 560 550 470
Electric distribution . . . . . . . . . . . . . . . . . . . . 551 510 560 595 605 610
Natural gas . . . . . . . . . . . . . . . . . . . . . . . . . . . 316 365 340 345 300 320
Nuclear fuel . . . . . . . . . . . . . . . . . . . . . . . . . . 90 140 100 135 135 75
Other . . . . . . . . . . . . . . . . . . . . . . . . . . . . . . . . 213 210 190 200 165 175
Total capital expenditures. . . . . . . . . . . . . . . $ 3,359 $ 2,890 $ 3,195 $ 2,625 $ 2,700 $ 2,685
By Project 2013 2014 2015 2016 2017 2018
Other major transmission projects . . . . . . . . . $ 335 $ 370 $ 265 $ 330 $ 420 $ 385
CapX2020 transmission project . . . . . . . . . . . 330 255 125 5 — —
PSCo CACJA . . . . . . . . . . . . . . . . . . . . . . . . . 350 250 85 10 — —
Natural gas pipeline replacement . . . . . . . . . . 115 160 180 145 125 125
Nuclear fuel . . . . . . . . . . . . . . . . . . . . . . . . . . 90 140 100 135 135 75
NSP-Minnesota wind projects . . . . . . . . . . . . — 35 610 — — —
Southwest infrastructure expansion . . . . . . . . — 5 70 170 290 385
NSP-Minnesota Black Dog. . . . . . . . . . . . . . . — 5 50 40 5 —
Other capital expenditures . . . . . . . . . . . . . . . 2,139 1,670 1,710 1,790 1,725 1,715
Total capital expenditures. . . . . . . . . . . . . . . $ 3,359 $ 2,890 $ 3,195 $ 2,625 $ 2,700 $ 2,685
The capital expenditure programs of Xcel Energy are subject to continuing review and modification. Actual utility capital
expenditures may vary from the estimates due to changes in electric and natural gas projected load growth, regulatory decisions,
legislative initiatives, reserve margin requirements, the availability of purchased power, alternative plans for meeting long-term energy
needs, compliance with environmental requirements, RPS and merger, acquisition and divestiture opportunities.