Xcel Energy 2013 Annual Report Download - page 165
Download and view the complete annual report
Please find page 165 of the 2013 Xcel Energy annual report below. You can navigate through the pages in the report by either clicking on the pages listed below, or by using the keyword search tool below to find specific information within the annual report.-
 1
1 -
2
-
3
-
4
-
5
-
6
-
7
-
8
-
9
-
10
-
11
-
12
-
13
-
14
-
15
-
16
-
17
-
18
-
19
-
20
-
21
-
22
-
23
-
24
-
25
-
26
-
27
-
28
-
29
-
30
-
31
-
32
-
33
-
34
-
35
-
36
-
37
-
38
-
39
-
40
-
41
-
42
-
43
-
44
-
45
-
46
-
47
-
48
-
49
-
50
-
51
-
52
-
53
-
54
-
55
-
56
-
57
-
58
-
59
-
60
-
61
-
62
-
63
-
64
-
65
-
66
-
67
-
68
-
69
-
70
-
71
-
72
-
73
-
74
-
75
-
76
-
77
-
78
-
79
-
80
-
81
-
82
-
83
-
84
-
85
-
86
-
87
-
88
-
89
-
90
-
91
-
92
-
93
-
94
-
95
-
96
-
97
-
98
-
99
-
100
-
101
-
102
-
103
-
104
-
105
-
106
-
107
-
108
-
109
-
110
-
111
-
112
-
113
-
114
-
115
-
116
-
117
-
118
-
119
-
120
-
121
-
122
-
123
-
124
-
125
-
126
-
127
-
128
-
129
-
130
-
131
-
132
-
133
-
134
-
135
-
136
-
137
-
138
-
139
-
140
-
141
-
142
-
143
-
144
-
145
-
146
-
147
-
148
-
149
-
150
-
151
-
152
-
153
-
154
-
 155
155 -
 156
156 -
 157
157 -
 158
158 -
 159
159 -
 160
160 -
 161
161 -
 162
162 -
 163
163 -
 164
164 -
 165
165 -
 166
166 -
 167
167 -
 168
168 -
 169
169 -
 170
170 -
 171
171 -
 172
172 -
 173
173 -
 174
174 -
 175
175 -
176
-
177
-
178
-
179
-
180
 |
 |

147
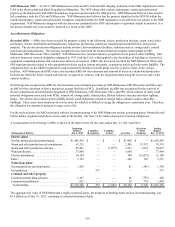
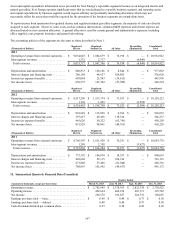
Asset and capital expenditure information is not provided for Xcel Energy’s reportable segments because as an integrated electric and
natural gas utility, Xcel Energy operates significant assets that are not dedicated to a specific business segment, and reporting assets
and capital expenditures by business segment would require arbitrary and potentially misleading allocations which may not
necessarily reflect the assets that would be required for the operation of the business segments on a stand-alone basis.
To report income from operations for regulated electric and regulated natural gas utility segments, the majority of costs are directly
assigned to each segment. However, some costs, such as common depreciation, common O&M expenses and interest expense are
allocated based on cost causation allocators. A general allocator is used for certain general and administrative expenses, including
office supplies, rent, property insurance and general advertising.
The accounting policies of the segments are the same as those described in Note 1.
(Thousands of Dollars) Regulated
Electric Regulated
Natural Gas All Other Reconciling
Eliminations Consolidated
Total
2013
Operating revenues from external customers . . $ 9,034,045 $ 1,804,679 $ 76,198 $ — $ 10,914,922
Intersegment revenues. . . . . . . . . . . . . . . . . . . . 1,332 2,717 — (4,049) —
Total revenues. . . . . . . . . . . . . . . . . . . . . . . . . $ 9,035,377 $ 1,807,396 $ 76,198 $ (4,049) $ 10,914,922
Depreciation and amortization . . . . . . . . . . . . . $ 840,833 $ 128,186 $ 8,844 $ — $ 977,863
Interest charges and financing costs . . . . . . . . . 386,198 44,927 104,895 — 536,020
Income tax expense (benefit). . . . . . . . . . . . . . . 495,044 25,543 (36,611) — 483,976
Net income (loss). . . . . . . . . . . . . . . . . . . . . . . . 850,572 123,702 (26,040) — 948,234
(Thousands of Dollars) Regulated
Electric Regulated
Natural Gas All Other Reconciling
Eliminations Consolidated
Total
2012
Operating revenues from external customers . . $ 8,517,296 $ 1,537,374 $ 73,553 $ — $ 10,128,223
Intersegment revenues. . . . . . . . . . . . . . . . . . . . 1,169 1,425 — (2,594) —
Total revenues. . . . . . . . . . . . . . . . . . . . . . . . . $ 8,518,465 $ 1,538,799 $ 73,553 $ (2,594) $ 10,128,223
Depreciation and amortization . . . . . . . . . . . . . $ 801,649 $ 115,038 $ 9,366 $ — $ 926,053
Interest charges and financing costs . . . . . . . . . 397,457 49,456 119,324 — 566,237
Income tax expense (benefit). . . . . . . . . . . . . . . 465,626 50,322 (65,745) — 450,203
Net income (loss). . . . . . . . . . . . . . . . . . . . . . . . 851,929 98,061 (44,761) — 905,229
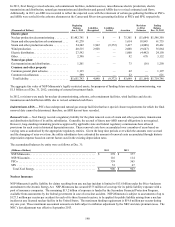
(Thousands of Dollars) Regulated
Electric Regulated
Natural Gas All Other Reconciling
Eliminations Consolidated
Total
2011
Operating revenues from external customers . . $ 8,766,593 $ 1,811,926 $ 76,251 $ — $ 10,654,770
Intersegment revenues. . . . . . . . . . . . . . . . . . . . 1,269 2,358 — (3,627) —
Total revenues. . . . . . . . . . . . . . . . . . . . . . . . . $ 8,767,862 $ 1,814,284 $ 76,251 $ (3,627) $ 10,654,770
Depreciation and amortization . . . . . . . . . . . . . $ 773,392 $ 106,870 $ 10,357 $ — $ 890,619
Interest charges and financing costs . . . . . . . . . 402,668 52,115 108,336 — 563,119
Income tax expense (benefit). . . . . . . . . . . . . . . 473,848 57,408 (62,940) — 468,316
Net income (loss). . . . . . . . . . . . . . . . . . . . . . . . 788,967 101,842 (49,637) — 841,172
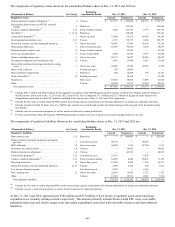
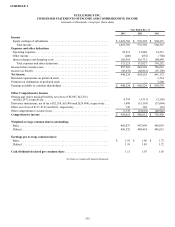
18. Summarized Quarterly Financial Data (Unaudited)
Quarter Ended
(Amounts in thousands, except per share data) March 31, 2013 June 30, 2013 Sept. 30, 2013 Dec. 31, 2013
Operating revenues . . . . . . . . . . . . . . . . . . . . . . . . . . . . . . . . . . . . $ 2,782,849 $ 2,578,913 $ 2,822,338 $ 2,730,822
Operating income . . . . . . . . . . . . . . . . . . . . . . . . . . . . . . . . . . . . . 454,624 402,236 665,113 325,582
Net income . . . . . . . . . . . . . . . . . . . . . . . . . . . . . . . . . . . . . . . . . . 236,570 196,857 364,752 150,055
Earnings per share total — basic. . . . . . . . . . . . . . . . . . . . . . . . . . $ 0.48 $ 0.40 $ 0.73 $ 0.30
Earnings per share total — diluted . . . . . . . . . . . . . . . . . . . . . . . . 0.48 0.40 0.73 0.30
Cash dividends declared per common share. . . . . . . . . . . . . . . . . 0.27 0.28 0.28 0.28