Xcel Energy 2013 Annual Report Download - page 70
Download and view the complete annual report
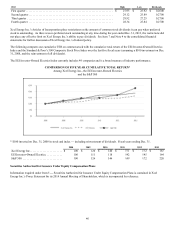
Please find page 70 of the 2013 Xcel Energy annual report below. You can navigate through the pages in the report by either clicking on the pages listed below, or by using the keyword search tool below to find specific information within the annual report.-
 1
1 -
2
-
3
-
4
-
5
-
6
-
7
-
8
-
9
-
10
-
11
-
12
-
13
-
14
-
15
-
16
-
17
-
18
-
19
-
20
-
21
-
22
-
23
-
24
-
25
-
26
-
27
-
28
-
29
-
30
-
31
-
32
-
33
-
34
-
35
-
36
-
37
-
38
-
39
-
40
-
41
-
42
-
43
-
44
-
45
-
46
-
47
-
48
-
49
-
50
-
51
-
52
-
53
-
54
-
55
-
56
-
57
-
58
-
59
-
 60
60 -
 61
61 -
 62
62 -
 63
63 -
 64
64 -
 65
65 -
 66
66 -
 67
67 -
 68
68 -
 69
69 -
 70
70 -
 71
71 -
 72
72 -
 73
73 -
 74
74 -
 75
75 -
 76
76 -
 77
77 -
 78
78 -
 79
79 -
 80
80 -
81
-
82
-
83
-
84
-
85
-
86
-
87
-
88
-
89
-
90
-
91
-
92
-
93
-
94
-
95
-
96
-
97
-
98
-
99
-
100
-
101
-
102
-
103
-
104
-
105
-
106
-
107
-
108
-
109
-
110
-
111
-
112
-
113
-
114
-
115
-
116
-
117
-
118
-
119
-
120
-
121
-
122
-
123
-
124
-
125
-
126
-
127
-
128
-
129
-
130
-
131
-
132
-
133
-
134
-
135
-
136
-
137
-
138
-
139
-
140
-
141
-
142
-
143
-
144
-
145
-
146
-
147
-
148
-
149
-
150
-
151
-
152
-
153
-
154
-
155
-
156
-
157
-
158
-
159
-
160
-
161
-
162
-
163
-
164
-
165
-
166
-
167
-
168
-
169
-
170
-
171
-
172
-
173
-
174
-
175
-
176
-
177
-
178
-
179
-
180
 |
 |

52
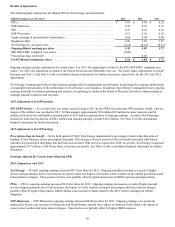
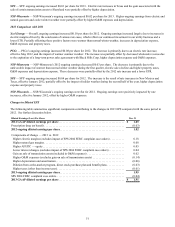
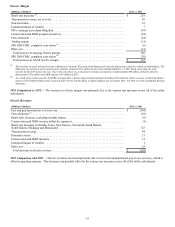
Diluted Earnings (Loss) Per Share Dec. 31
2011 GAAP and ongoing diluted earnings per share. . . . . . . . . . . . . . . . . . . . . . . . . . . . . . . . . . . $ 1.72
Components of change — 2012 vs. 2011
Higher electric margins. . . . . . . . . . . . . . . . . . . . . . . . . . . . . . . . . . . . . . . . . . . . . . . . . . . . . . . . . . . 0.15
Lower ETR . . . . . . . . . . . . . . . . . . . . . . . . . . . . . . . . . . . . . . . . . . . . . . . . . . . . . . . . . . . . . . . . . . . . 0.04
Lower conservation and DSM expenses (generally offset in revenues). . . . . . . . . . . . . . . . . . . . . . 0.03
Higher AFUDC — equity. . . . . . . . . . . . . . . . . . . . . . . . . . . . . . . . . . . . . . . . . . . . . . . . . . . . . . . . . 0.02
Higher natural gas margins . . . . . . . . . . . . . . . . . . . . . . . . . . . . . . . . . . . . . . . . . . . . . . . . . . . . . . . . 0.01
Higher O&M expenses . . . . . . . . . . . . . . . . . . . . . . . . . . . . . . . . . . . . . . . . . . . . . . . . . . . . . . . . . . . (0.05)
Higher depreciation and amortization. . . . . . . . . . . . . . . . . . . . . . . . . . . . . . . . . . . . . . . . . . . . . . . . (0.04)
Higher taxes (other than income taxes). . . . . . . . . . . . . . . . . . . . . . . . . . . . . . . . . . . . . . . . . . . . . . . (0.04)
Higher interest charges . . . . . . . . . . . . . . . . . . . . . . . . . . . . . . . . . . . . . . . . . . . . . . . . . . . . . . . . . . . (0.01)
Other, net (including interest and premium on redemption of preferred stock) . . . . . . . . . . . . . . . . (0.01)
2012 ongoing diluted earnings per share. . . . . . . . . . . . . . . . . . . . . . . . . . . . . . . . . . . . . . . . . . . . . 1.82
Prescription drug tax benefit . . . . . . . . . . . . . . . . . . . . . . . . . . . . . . . . . . . . . . . . . . . . . . . . . . . . . . . . 0.03
2012 GAAP diluted earnings per share. . . . . . . . . . . . . . . . . . . . . . . . . . . . . . . . . . . . . . . . . . . . . . $ 1.85
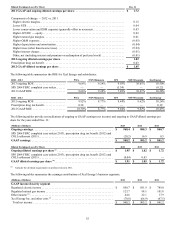
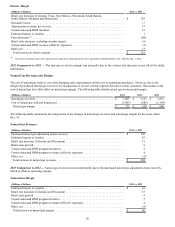
The following table summarizes the ROE for Xcel Energy and subsidiaries:
ROE - 2013 PSCo NSP-Minnesota SPS NSP-Wisconsin Xcel Energy
2013 ongoing ROE . . . . . . . . . . . . . . . . . . . . . . 9.66% 9.24% 9.03% 10.61% 10.50%
SPS 2004 FERC complaint case orders. . . . . . . — — (1.54) — (0.22)
2013 GAAP ROE . . . . . . . . . . . . . . . . . . . . . . . 9.66% 9.24% 7.49% 10.61% 10.28%
ROE - 2012 PSCo NSP-Minnesota SPS NSP-Wisconsin Xcel Energy
2012 ongoing ROE . . . . . . . . . . . . . . . . . . . . . . 9.92% 8.77% 9.44% 9.62% 10.24%
Prescription drug tax benefit . . . . . . . . . . . . . . . 0.38 — — — 0.19
2012 GAAP ROE . . . . . . . . . . . . . . . . . . . . . . . 10.30% 8.77% 9.44% 9.62% 10.43%
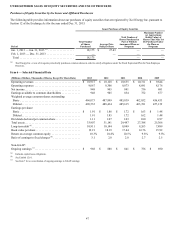
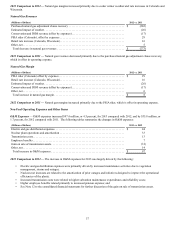
The following tables provide reconciliations of ongoing to GAAP earnings (net income) and ongoing to GAAP diluted earnings per
share for the years ended Dec. 31:
(Millions of Dollars) 2013 2012 2011
Ongoing earnings. . . . . . . . . . . . . . . . . . . . . . . . . . . . . . . . . . . . . . . . . . . . . . . . . . . . . . . . $ 968.4 $ 888.3 $ 840.7
SPS 2004 FERC complaint case orders (2013), prescription drug tax benefit (2012) and
COLI settlement (2011). . . . . . . . . . . . . . . . . . . . . . . . . . . . . . . . . . . . . . . . . . . . . . . . . . . . (20.2) 16.9 0.5
GAAP earnings. . . . . . . . . . . . . . . . . . . . . . . . . . . . . . . . . . . . . . . . . . . . . . . . . . . . . . . . . . $ 948.2 $ 905.2 $ 841.2
Diluted Earnings (Loss) Per Share 2013 2012 2011
Ongoing diluted earnings per share (a) . . . . . . . . . . . . . . . . . . . . . . . . . . . . . . . . . . . . . . . $ 1.95 $ 1.82 $ 1.72
SPS 2004 FERC complaint case orders (2013), prescription drug tax benefit (2012) and
COLI settlement (2011). . . . . . . . . . . . . . . . . . . . . . . . . . . . . . . . . . . . . . . . . . . . . . . . . . . . (0.04) 0.03 —
GAAP diluted earnings per share (a). . . . . . . . . . . . . . . . . . . . . . . . . . . . . . . . . . . . . . . . . $ 1.91 $ 1.85 $ 1.72
(a) Includes the dividend requirements on preferred stock in 2011.
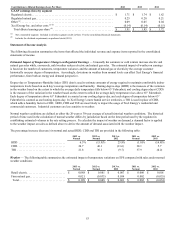
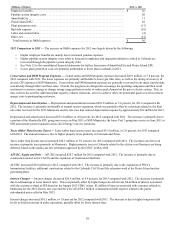
The following tables summarize the earnings contributions of Xcel Energy’s business segments.
(Millions of Dollars) 2013 2012 2011
GAAP income (loss) by segment
Regulated electric income . . . . . . . . . . . . . . . . . . . . . . . . . . . . . . . . . . . . . . . . . . . . . . . . . . $ 850.7 $ 851.9 $ 789.0
Regulated natural gas income . . . . . . . . . . . . . . . . . . . . . . . . . . . . . . . . . . . . . . . . . . . . . . . 123.7 98.1 101.8
Other income (a) . . . . . . . . . . . . . . . . . . . . . . . . . . . . . . . . . . . . . . . . . . . . . . . . . . . . . . . . . . 44.6 22.1 17.9
Xcel Energy Inc. and other costs (a) . . . . . . . . . . . . . . . . . . . . . . . . . . . . . . . . . . . . . . . . . . . (70.8)(66.9) (67.5)
Total net income . . . . . . . . . . . . . . . . . . . . . . . . . . . . . . . . . . . . . . . . . . . . . . . . . . . . . . . . $ 948.2 $ 905.2 $ 841.2