Xcel Energy 2013 Annual Report Download - page 84
Download and view the complete annual report
Please find page 84 of the 2013 Xcel Energy annual report below. You can navigate through the pages in the report by either clicking on the pages listed below, or by using the keyword search tool below to find specific information within the annual report.-
 1
1 -
2
-
3
-
4
-
5
-
6
-
7
-
8
-
9
-
10
-
11
-
12
-
13
-
14
-
15
-
16
-
17
-
18
-
19
-
20
-
21
-
22
-
23
-
24
-
25
-
26
-
27
-
28
-
29
-
30
-
31
-
32
-
33
-
34
-
35
-
36
-
37
-
38
-
39
-
40
-
41
-
42
-
43
-
44
-
45
-
46
-
47
-
48
-
49
-
50
-
51
-
52
-
53
-
54
-
55
-
56
-
57
-
58
-
59
-
60
-
61
-
62
-
63
-
64
-
65
-
66
-
67
-
68
-
69
-
70
-
71
-
72
-
73
-
 74
74 -
 75
75 -
 76
76 -
 77
77 -
 78
78 -
 79
79 -
 80
80 -
 81
81 -
 82
82 -
 83
83 -
 84
84 -
 85
85 -
 86
86 -
 87
87 -
 88
88 -
 89
89 -
 90
90 -
 91
91 -
 92
92 -
 93
93 -
 94
94 -
95
-
96
-
97
-
98
-
99
-
100
-
101
-
102
-
103
-
104
-
105
-
106
-
107
-
108
-
109
-
110
-
111
-
112
-
113
-
114
-
115
-
116
-
117
-
118
-
119
-
120
-
121
-
122
-
123
-
124
-
125
-
126
-
127
-
128
-
129
-
130
-
131
-
132
-
133
-
134
-
135
-
136
-
137
-
138
-
139
-
140
-
141
-
142
-
143
-
144
-
145
-
146
-
147
-
148
-
149
-
150
-
151
-
152
-
153
-
154
-
155
-
156
-
157
-
158
-
159
-
160
-
161
-
162
-
163
-
164
-
165
-
166
-
167
-
168
-
169
-
170
-
171
-
172
-
173
-
174
-
175
-
176
-
177
-
178
-
179
-
180
 |
 |

66
Commodity Price Risk — Xcel Energy Inc.’s utility subsidiaries are exposed to commodity price risk in their electric and natural gas
operations. Commodity price risk is managed by entering into long- and short-term physical purchase and sales contracts for electric
capacity, energy and energy-related products and for various fuels used in generation and distribution activities. Commodity price risk
is also managed through the use of financial derivative instruments. Xcel Energy’s risk management policy allows it to manage
commodity price risk within each rate-regulated operation to the extent such exposure exists.
Wholesale and Commodity Trading Risk — Xcel Energy Inc.’s utility subsidiaries conduct various wholesale and commodity trading
activities, including the purchase and sale of electric capacity, energy and energy-related instruments. Xcel Energy’s risk management
policy allows management to conduct these activities within guidelines and limitations as approved by its risk management
committee, which is made up of management personnel not directly involved in the activities governed by this policy.
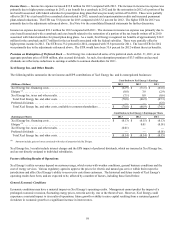
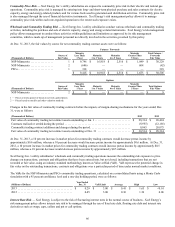
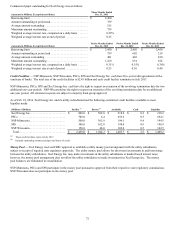
At Dec. 31, 2013, the fair values by source for net commodity trading contract assets were as follows:
Futures / Forwards
(Thousands of Dollars) Source of
Fair Value
Maturity
Less Than
1 Year Maturity
1 to 3 Years Maturity
4 to 5 Years
Maturity
Greater Than
5 Years
Total Futures /
Forwards
Fair Value
NSP-Minnesota . . . . . . . . . . . . . . . . 1 $ 9,746 $ 16,918 $ 2,516 $ 1,049 $ 30,229
NSP-Minnesota . . . . . . . . . . . . . . . . 2 (646) — — 604 (42)
PSCo. . . . . . . . . . . . . . . . . . . . . . . . . 1 318 — — — 318
$ 9,418 $ 16,918 $ 2,516 $ 1,653 $ 30,505
Options
(Thousands of Dollars) Source of
Fair Value
Maturity
Less Than
1 Year Maturity
1 to 3 Years Maturity
4 to 5 Years
Maturity
Greater Than
5 Years Total Options
Fair Value
NSP-Minnesota . . . . . . . . . . . . . . . . 2 $ 9 $ — $ — $ — $ 9
1 — Prices actively quoted or based on actively quoted prices.
2 — Prices based on models and other valuation methods.
Changes in the fair value of commodity trading contracts before the impacts of margin-sharing mechanisms for the years ended Dec.
31, were as follows:
(Thousands of Dollars) 2013 2012
Fair value of commodity trading net contract assets outstanding at Jan. 1 . . . . . . . . . . . . . . . . . . . . . . . . . $ 28,314 $ 20,424
Contracts realized or settled during the period . . . . . . . . . . . . . . . . . . . . . . . . . . . . . . . . . . . . . . . . . . . . . . (6,665) (12,185)
Commodity trading contract additions and changes during the period . . . . . . . . . . . . . . . . . . . . . . . . . . . . 8,865 20,075
Fair value of commodity trading net contract assets outstanding at Dec. 31 . . . . . . . . . . . . . . . . . . . . . . . $ 30,514 $ 28,314
At Dec. 31, 2013, a 10 percent increase in market prices for commodity trading contracts would decrease pretax income by
approximately $0.6 million, whereas a 10 percent decrease would increase pretax income by approximately $0.6 million. At Dec. 31,
2012, a 10 percent increase in market prices for commodity trading contracts would increase pretax income by approximately $0.5
million, whereas a 10 percent decrease would decrease pretax income by approximately $0.5 million.
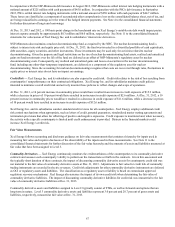
Xcel Energy Inc.’s utility subsidiaries’ wholesale and commodity trading operations measure the outstanding risk exposure to price
changes on transactions, contracts and obligations that have been entered into, but not closed, including transactions that are not
recorded at fair value, using an industry standard methodology known as Value at Risk (VaR). VaR expresses the potential change in
fair value on the outstanding transactions, contracts and obligations over a particular period of time under normal market conditions.
The VaRs for the NSP-Minnesota and PSCo commodity trading operations, calculated on a consolidated basis using a Monte Carlo
simulation with a 95 percent confidence level and a one-day holding period, were as follows:
(Millions of Dollars) Year Ended
Dec. 31 VaR Limit Average High Low
2013 . . . . . . . . . . . . . . . . . . . . . . . . . . . . . . . . . . . . . . $ 0.29 $ 3.00 $ 0.41 $ 1.65 $ <0.01
2012 . . . . . . . . . . . . . . . . . . . . . . . . . . . . . . . . . . . . . . 0.45 3.00 0.36 1.56 0.06
Interest Rate Risk — Xcel Energy is subject to the risk of fluctuating interest rates in the normal course of business. Xcel Energy’s
risk management policy allows interest rate risk to be managed through the use of fixed rate debt, floating rate debt and interest rate
derivatives such as swaps, caps, collars and put or call options.