Xcel Energy 2013 Annual Report Download - page 65
Download and view the complete annual report
Please find page 65 of the 2013 Xcel Energy annual report below. You can navigate through the pages in the report by either clicking on the pages listed below, or by using the keyword search tool below to find specific information within the annual report.-
 1
1 -
2
-
3
-
4
-
5
-
6
-
7
-
8
-
9
-
10
-
11
-
12
-
13
-
14
-
15
-
16
-
17
-
18
-
19
-
20
-
21
-
22
-
23
-
24
-
25
-
26
-
27
-
28
-
29
-
30
-
31
-
32
-
33
-
34
-
35
-
36
-
37
-
38
-
39
-
40
-
41
-
42
-
43
-
44
-
45
-
46
-
47
-
48
-
49
-
50
-
51
-
52
-
53
-
54
-
 55
55 -
 56
56 -
 57
57 -
 58
58 -
 59
59 -
 60
60 -
 61
61 -
 62
62 -
 63
63 -
 64
64 -
 65
65 -
 66
66 -
 67
67 -
 68
68 -
 69
69 -
 70
70 -
 71
71 -
 72
72 -
 73
73 -
 74
74 -
 75
75 -
76
-
77
-
78
-
79
-
80
-
81
-
82
-
83
-
84
-
85
-
86
-
87
-
88
-
89
-
90
-
91
-
92
-
93
-
94
-
95
-
96
-
97
-
98
-
99
-
100
-
101
-
102
-
103
-
104
-
105
-
106
-
107
-
108
-
109
-
110
-
111
-
112
-
113
-
114
-
115
-
116
-
117
-
118
-
119
-
120
-
121
-
122
-
123
-
124
-
125
-
126
-
127
-
128
-
129
-
130
-
131
-
132
-
133
-
134
-
135
-
136
-
137
-
138
-
139
-
140
-
141
-
142
-
143
-
144
-
145
-
146
-
147
-
148
-
149
-
150
-
151
-
152
-
153
-
154
-
155
-
156
-
157
-
158
-
159
-
160
-
161
-
162
-
163
-
164
-
165
-
166
-
167
-
168
-
169
-
170
-
171
-
172
-
173
-
174
-
175
-
176
-
177
-
178
-
179
-
180
 |
 |

47
UNREGISTERED SALES OF EQUITY SECURITIES AND USE OF PROCEEDS
Purchases of Equity Securities by the Issuer and Affiliated Purchasers
The following table provides information about our purchases of equity securities that are registered by Xcel Energy Inc. pursuant to
Section 12 of the Exchange Act for the year ended Dec. 31, 2013:
Issuer Purchases of Equity Securities
Period
Total Number
of Shares
Purchased Average Price
Paid per Share
Total Number of
Shares Purchased as
Part of Publicly
Announced Plans or
Programs
Maximum Number
(or Approximate
Dollar Value) of
Shares That May Yet
Be Purchased Under
the Plans or
Programs
Jan. 1, 2013 — Jan. 31, 2013 (a) . . . . . . . . . . . . . . . . . . 18,175 $ 27.43 — —
Feb. 1, 2013 — Dec. 31, 2013 . . . . . . . . . . . . . . . . . . . — — — —
Total . . . . . . . . . . . . . . . . . . . . . . . . . . . . . . . . . . . . . . 18,175 — —
(a) Xcel Energy Inc. or one of its agents periodically purchases common shares in order to satisfy obligations under the Stock Equivalent Plan for Non-Employee
Directors.
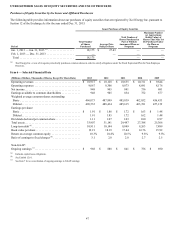
Item 6 — Selected Financial Data
(Millions of Dollars, Thousands of Shares, Except Per Share Data) 2013 2012 2011 2010 2009
Operating revenues . . . . . . . . . . . . . . . . . . . . . . . . . . . . . . . . $ 10,915 $ 10,128 $ 10,655 $ 10,311 $ 9,644
Operating expenses . . . . . . . . . . . . . . . . . . . . . . . . . . . . . . . . 9,067 8,306 8,873 8,691 8,176
Net income. . . . . . . . . . . . . . . . . . . . . . . . . . . . . . . . . . . . . . . 948 905 841 756 681
Earnings available to common shareholders . . . . . . . . . . . . . 948 905 834 752 677
Weighted average common shares outstanding:
Basic . . . . . . . . . . . . . . . . . . . . . . . . . . . . . . . . . . . . . . . . . . 496,073 487,899 485,039 462,052 456,433
Diluted. . . . . . . . . . . . . . . . . . . . . . . . . . . . . . . . . . . . . . . . . 496,532 488,434 485,615 463,391 457,139
Earnings per share:
Basic . . . . . . . . . . . . . . . . . . . . . . . . . . . . . . . . . . . . . . . . . . $ 1.91 $ 1.86 $ 1.72 $ 1.63 $ 1.48
Diluted. . . . . . . . . . . . . . . . . . . . . . . . . . . . . . . . . . . . . . . . . 1.91 1.85 1.72 1.62 1.48
Dividends declared per common share . . . . . . . . . . . . . . . . . 1.11 1.07 1.03 1.00 0.97
Total assets. . . . . . . . . . . . . . . . . . . . . . . . . . . . . . . . . . . . . . . 33,907 31,141 29,497 27,388 25,306
Long-term debt (a). . . . . . . . . . . . . . . . . . . . . . . . . . . . . . . . . . 10,911 10,144 8,849 9,263 7,889
Book value per share . . . . . . . . . . . . . . . . . . . . . . . . . . . . . . . 19.21 18.19 17.44 16.76 15.92
Return on average common equity . . . . . . . . . . . . . . . . . . . . 10.3% 10.4% 10.1% 9.8% 9.5%
Ratio of earnings to fixed charges (b) . . . . . . . . . . . . . . . . . . . 3.1 2.8 2.8 2.7 2.5
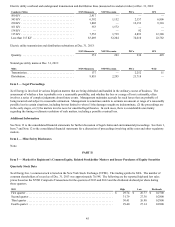
Non-GAAP:
Ongoing earnings (c) . . . . . . . . . . . . . . . . . . . . . . . . . . . . . . . . $ 968 $ 888 $ 841 $ 756 $ 690
(a) Includes capital lease obligations.
(b) See Exhibit 12.01.
(c) See Item 7 for a reconciliation of ongoing earnings to GAAP earnings.