Xcel Energy 2013 Annual Report Download - page 72
Download and view the complete annual report
Please find page 72 of the 2013 Xcel Energy annual report below. You can navigate through the pages in the report by either clicking on the pages listed below, or by using the keyword search tool below to find specific information within the annual report.-
 1
1 -
2
-
3
-
4
-
5
-
6
-
7
-
8
-
9
-
10
-
11
-
12
-
13
-
14
-
15
-
16
-
17
-
18
-
19
-
20
-
21
-
22
-
23
-
24
-
25
-
26
-
27
-
28
-
29
-
30
-
31
-
32
-
33
-
34
-
35
-
36
-
37
-
38
-
39
-
40
-
41
-
42
-
43
-
44
-
45
-
46
-
47
-
48
-
49
-
50
-
51
-
52
-
53
-
54
-
55
-
56
-
57
-
58
-
59
-
60
-
61
-
 62
62 -
 63
63 -
 64
64 -
 65
65 -
 66
66 -
 67
67 -
 68
68 -
 69
69 -
 70
70 -
 71
71 -
 72
72 -
 73
73 -
 74
74 -
 75
75 -
 76
76 -
 77
77 -
 78
78 -
 79
79 -
 80
80 -
 81
81 -
 82
82 -
83
-
84
-
85
-
86
-
87
-
88
-
89
-
90
-
91
-
92
-
93
-
94
-
95
-
96
-
97
-
98
-
99
-
100
-
101
-
102
-
103
-
104
-
105
-
106
-
107
-
108
-
109
-
110
-
111
-
112
-
113
-
114
-
115
-
116
-
117
-
118
-
119
-
120
-
121
-
122
-
123
-
124
-
125
-
126
-
127
-
128
-
129
-
130
-
131
-
132
-
133
-
134
-
135
-
136
-
137
-
138
-
139
-
140
-
141
-
142
-
143
-
144
-
145
-
146
-
147
-
148
-
149
-
150
-
151
-
152
-
153
-
154
-
155
-
156
-
157
-
158
-
159
-
160
-
161
-
162
-
163
-
164
-
165
-
166
-
167
-
168
-
169
-
170
-
171
-
172
-
173
-
174
-
175
-
176
-
177
-
178
-
179
-
180
 |
 |

54
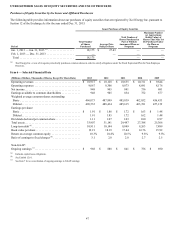
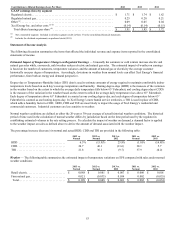
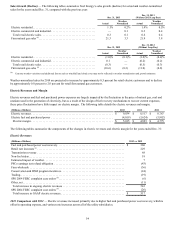
Sales Growth (Decline) — The following tables summarize Xcel Energy’s sales growth (decline) for actual and weather-normalized
sales for the years ended Dec. 31, compared with the previous year:
Dec. 31, 2013 Dec. 31, 2013
(Without 2012 Leap Day)
Actual Weather
Normalized Actual Weather
Normalized
Electric residential. . . . . . . . . . . . . . . . . . . . . . . . . . . . . . . . . . . . . . . . . . . . 1.1% 0.2% 1.4% 0.5%
Electric commercial and industrial . . . . . . . . . . . . . . . . . . . . . . . . . . . . . . . — 0.1 0.3 0.4
Total retail electric sales . . . . . . . . . . . . . . . . . . . . . . . . . . . . . . . . . . . . . . 0.3 0.1 0.6 0.4
Firm natural gas sales (a). . . . . . . . . . . . . . . . . . . . . . . . . . . . . . . . . . . . . . . . 21.3 3.3 21.9 3.8
Dec. 31, 2012 Dec. 31, 2012
(Without Leap Day)
Actual Weather
Normalized Actual Weather
Normalized
Electric residential. . . . . . . . . . . . . . . . . . . . . . . . . . . . . . . . . . . . . . . . . . . . (1.0)% (0.1)% (1.2)% (0.4)%
Electric commercial and industrial . . . . . . . . . . . . . . . . . . . . . . . . . . . . . . . 0.1 — (0.2) (0.2)
Total retail electric sales . . . . . . . . . . . . . . . . . . . . . . . . . . . . . . . . . . . . . . (0.3) — (0.5) (0.3)
Firm natural gas sales (a) . . . . . . . . . . . . . . . . . . . . . . . . . . . . . . . . . . . . . . . (10.6) (0.3) (11.0) (0.8)
(a) Extreme weather variations and additional factors such as windchill and cloud cover may not be reflected in weather normalization and growth estimates.
Weather-normalized sales for 2014 are projected to increase by approximately 0.5 percent for retail electric customers and to decline
by approximately 0.0 percent to 2.0 percent for retail firm natural gas customers.
Electric Revenues and Margin
Electric revenues and fuel and purchased power expenses are largely impacted by the fluctuation in the price of natural gas, coal and
uranium used in the generation of electricity, but as a result of the design of fuel recovery mechanisms to recover current expenses,
these price fluctuations have little impact on electric margin. The following table details the electric revenues and margin:
(Millions of Dollars) 2013 2012 2011
Electric revenues . . . . . . . . . . . . . . . . . . . . . . . . . . . . . . . . . . . . . . . . . . . . . . . . . . . . . . . . . $ 9,034 $ 8,517 $ 8,767
Electric fuel and purchased power . . . . . . . . . . . . . . . . . . . . . . . . . . . . . . . . . . . . . . . . . . . (4,019)(3,624) (3,992)
Electric margin . . . . . . . . . . . . . . . . . . . . . . . . . . . . . . . . . . . . . . . . . . . . . . . . . . . . . . . . . $ 5,015 $ 4,893 $ 4,775
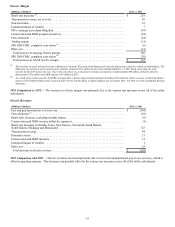
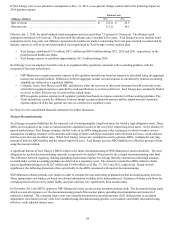
The following tables summarize the components of the changes in electric revenues and electric margin for the years ended Dec. 31:
Electric Revenues
(Millions of Dollars) 2013 vs. 2012
Fuel and purchased power cost recovery. . . . . . . . . . . . . . . . . . . . . . . . . . . . . . . . . . . . . . . . . . . . . . . $ 360
Retail rate increases (a) . . . . . . . . . . . . . . . . . . . . . . . . . . . . . . . . . . . . . . . . . . . . . . . . . . . . . . . . . . . . . 229
Transmission revenue . . . . . . . . . . . . . . . . . . . . . . . . . . . . . . . . . . . . . . . . . . . . . . . . . . . . . . . . . . . . . 68
Non-fuel riders. . . . . . . . . . . . . . . . . . . . . . . . . . . . . . . . . . . . . . . . . . . . . . . . . . . . . . . . . . . . . . . . . . . 18
Estimated impact of weather . . . . . . . . . . . . . . . . . . . . . . . . . . . . . . . . . . . . . . . . . . . . . . . . . . . . . . . . 7
PSCo earnings test refund obligation . . . . . . . . . . . . . . . . . . . . . . . . . . . . . . . . . . . . . . . . . . . . . . . . . (43)
Firm wholesale . . . . . . . . . . . . . . . . . . . . . . . . . . . . . . . . . . . . . . . . . . . . . . . . . . . . . . . . . . . . . . . . . . (36)
Conservation and DSM program incentives . . . . . . . . . . . . . . . . . . . . . . . . . . . . . . . . . . . . . . . . . . . . (24)
Trading. . . . . . . . . . . . . . . . . . . . . . . . . . . . . . . . . . . . . . . . . . . . . . . . . . . . . . . . . . . . . . . . . . . . . . . . . (19)
SPS 2004 FERC complaint case orders (b). . . . . . . . . . . . . . . . . . . . . . . . . . . . . . . . . . . . . . . . . . . . . . (6)
Other, net. . . . . . . . . . . . . . . . . . . . . . . . . . . . . . . . . . . . . . . . . . . . . . . . . . . . . . . . . . . . . . . . . . . . . . . (11)
Total increase in ongoing electric revenues . . . . . . . . . . . . . . . . . . . . . . . . . . . . . . . . . . . . . . . . . . . 543
SPS 2004 FERC complaint case orders (b). . . . . . . . . . . . . . . . . . . . . . . . . . . . . . . . . . . . . . . . . . . . . . (26)
Total increase in GAAP electric revenues. . . . . . . . . . . . . . . . . . . . . . . . . . . . . . . . . . . . . . . . . . . . . $ 517
2013 Comparison with 2012 — Electric revenues increased primarily due to higher fuel and purchased power cost recovery, which is
offset in operating expense, and various rate increases across all of the utility subsidiaries.