Xcel Energy 2013 Annual Report Download - page 86
Download and view the complete annual report
Please find page 86 of the 2013 Xcel Energy annual report below. You can navigate through the pages in the report by either clicking on the pages listed below, or by using the keyword search tool below to find specific information within the annual report.-
 1
1 -
2
-
3
-
4
-
5
-
6
-
7
-
8
-
9
-
10
-
11
-
12
-
13
-
14
-
15
-
16
-
17
-
18
-
19
-
20
-
21
-
22
-
23
-
24
-
25
-
26
-
27
-
28
-
29
-
30
-
31
-
32
-
33
-
34
-
35
-
36
-
37
-
38
-
39
-
40
-
41
-
42
-
43
-
44
-
45
-
46
-
47
-
48
-
49
-
50
-
51
-
52
-
53
-
54
-
55
-
56
-
57
-
58
-
59
-
60
-
61
-
62
-
63
-
64
-
65
-
66
-
67
-
68
-
69
-
70
-
71
-
72
-
73
-
74
-
75
-
 76
76 -
 77
77 -
 78
78 -
 79
79 -
 80
80 -
 81
81 -
 82
82 -
 83
83 -
 84
84 -
 85
85 -
 86
86 -
 87
87 -
 88
88 -
 89
89 -
 90
90 -
 91
91 -
 92
92 -
 93
93 -
 94
94 -
 95
95 -
 96
96 -
97
-
98
-
99
-
100
-
101
-
102
-
103
-
104
-
105
-
106
-
107
-
108
-
109
-
110
-
111
-
112
-
113
-
114
-
115
-
116
-
117
-
118
-
119
-
120
-
121
-
122
-
123
-
124
-
125
-
126
-
127
-
128
-
129
-
130
-
131
-
132
-
133
-
134
-
135
-
136
-
137
-
138
-
139
-
140
-
141
-
142
-
143
-
144
-
145
-
146
-
147
-
148
-
149
-
150
-
151
-
152
-
153
-
154
-
155
-
156
-
157
-
158
-
159
-
160
-
161
-
162
-
163
-
164
-
165
-
166
-
167
-
168
-
169
-
170
-
171
-
172
-
173
-
174
-
175
-
176
-
177
-
178
-
179
-
180
 |
 |

68
Determining the fair value of FTRs requires numerous management forecasts that vary in observability, including various forward
commodity prices, retail and wholesale demand, generation and resulting transmission system congestion. Given the limited
observability of management’s forecasts for several of these inputs, these instruments have been assigned a Level 3. Level 3
commodity derivatives assets and liabilities included $48.3 million and $10.0 million of estimated fair values, respectively, for FTRs
held at Dec. 31, 2013.
Determining the fair value of certain commodity forwards and options can require management to make use of subjective price and
volatility forecasts which extend to periods beyond those readily observable on active exchanges or quoted by brokers. When less
observable forward price and volatility forecasts are significant to determining the value of commodity forwards and options, these
instruments are assigned to Level 3. Level 3 commodity derivative assets and liabilities included $3.4 million and zero of estimated
fair values, respectively, for forwards held at Dec. 31, 2013. There were no Level 3 options held at Dec. 31, 2013.
Nuclear Decommissioning Fund — Nuclear decommissioning fund assets assigned to Level 3 consist of private equity investments
and real estate investments. Based on an evaluation of NSP-Minnesota’s ability to redeem private equity investments and real estate
investment funds measured at net asset value, estimated fair values for these investments totaling $120.1 million in the nuclear
decommissioning fund at Dec. 31, 2013 (approximately 6.9 percent of total assets measured at fair value) are assigned to Level 3.
Realized and unrealized gains and losses on nuclear decommissioning fund investments are deferred as a regulatory asset.
Liquidity and Capital Resources
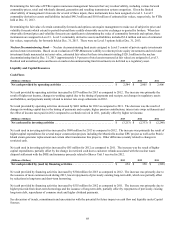
Cash Flows
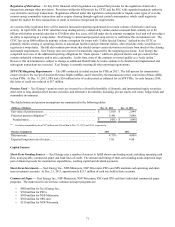
(Millions of Dollars) 2013 2012 2011
Net cash provided by operating activities . . . . . . . . . . . . . . . . . . . . . . . . . . . . . . . . . . . . $ 2,584 $ 2,005 $ 2,406
Net cash provided by operating activities increased by $579 million for 2013 as compared to 2012. The increase was primarily the
result of higher net income, changes in working capital due to the timing of payments and receipts, net changes in regulatory assets
and liabilities, and payments mainly related to interest rate swap settlements in 2012.
Net cash provided by operating activities decreased by $401 million for 2012 as compared to 2011. The decrease was the result of
changes in working capital due to the timing of payments and receipts, higher pension contributions, interest rate swap settlements and
the effect of income taxes paid in 2012 compared to a refund received in 2011, partially offset by higher net income.
(Millions of Dollars) 2013 2012 2011
Net cash used in investing activities . . . . . . . . . . . . . . . . . . . . . . . . . . . . . . . . . . . . . . . . . $ (3,213) $ (2,333) $ (2,248)
Net cash used in investing activities increased by $880 million for 2013 as compared to 2012. The increase was primarily the result of
higher capital expenditures for several major construction projects including the Monticello nuclear EPU project as well as the Prairie
Island steam generator replacement and certain other transmission line projects. Other differences mainly related to changes in
restricted cash.
Net cash used in investing activities increased by $85 million for 2012 as compared to 2011. The increase was the result of higher
capital expenditures, partially offset by the change in restricted cash due to customer refunds associated with the nuclear waste
disposal settlement with the DOE and insurance proceeds related to Sherco Unit 3 received in 2012.
(Millions of Dollars) 2013 2012 2011
Net cash provided by (used in) financing activities. . . . . . . . . . . . . . . . . . . . . . . . . . . . . $ 654 $ 350 $ (205)
Net cash provided by financing activities increased by $304 million for 2013 as compared to 2012. The increase was primarily due to
the issuance of more common stock during 2013, lower repayments of previously existing long-term debt, which was partially offset
by reductions in long-term and short-term borrowing.
Net cash provided by financing activities increased by $555 million for 2012 as compared to 2011. The increase was primarily due to
higher proceeds from short-term borrowings and the issuance of long-term debt, partially offset by repayments of previously existing
long-term debt, repurchases of common stock and higher dividend payments.
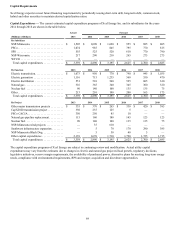
See discussion of trends, commitments and uncertainties with the potential for future impact on cash flow and liquidity under Capital
Sources.