Xcel Energy 2013 Annual Report Download - page 129
Download and view the complete annual report
Please find page 129 of the 2013 Xcel Energy annual report below. You can navigate through the pages in the report by either clicking on the pages listed below, or by using the keyword search tool below to find specific information within the annual report.-
 1
1 -
2
-
3
-
4
-
5
-
6
-
7
-
8
-
9
-
10
-
11
-
12
-
13
-
14
-
15
-
16
-
17
-
18
-
19
-
20
-
21
-
22
-
23
-
24
-
25
-
26
-
27
-
28
-
29
-
30
-
31
-
32
-
33
-
34
-
35
-
36
-
37
-
38
-
39
-
40
-
41
-
42
-
43
-
44
-
45
-
46
-
47
-
48
-
49
-
50
-
51
-
52
-
53
-
54
-
55
-
56
-
57
-
58
-
59
-
60
-
61
-
62
-
63
-
64
-
65
-
66
-
67
-
68
-
69
-
70
-
71
-
72
-
73
-
74
-
75
-
76
-
77
-
78
-
79
-
80
-
81
-
82
-
83
-
84
-
85
-
86
-
87
-
88
-
89
-
90
-
91
-
92
-
93
-
94
-
95
-
96
-
97
-
98
-
99
-
100
-
101
-
102
-
103
-
104
-
105
-
106
-
107
-
108
-
109
-
110
-
111
-
112
-
113
-
114
-
115
-
116
-
117
-
118
-
 119
119 -
 120
120 -
 121
121 -
 122
122 -
 123
123 -
 124
124 -
 125
125 -
 126
126 -
 127
127 -
 128
128 -
 129
129 -
 130
130 -
 131
131 -
 132
132 -
 133
133 -
 134
134 -
 135
135 -
 136
136 -
 137
137 -
 138
138 -
 139
139 -
140
-
141
-
142
-
143
-
144
-
145
-
146
-
147
-
148
-
149
-
150
-
151
-
152
-
153
-
154
-
155
-
156
-
157
-
158
-
159
-
160
-
161
-
162
-
163
-
164
-
165
-
166
-
167
-
168
-
169
-
170
-
171
-
172
-
173
-
174
-
175
-
176
-
177
-
178
-
179
-
180
 |
 |

111
2013 2012 2011
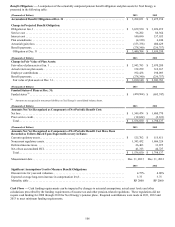
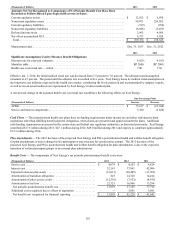
Significant Assumptions Used to Measure Costs:
Discount rate . . . . . . . . . . . . . . . . . . . . . . . . . . . . . . . . . . . . . . . . . . . . . . . . 4.10% 5.00% 5.50%
Expected average long-term rate of return on assets. . . . . . . . . . . . . . . . . . 7.11 6.75 7.50
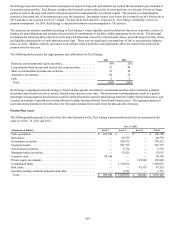
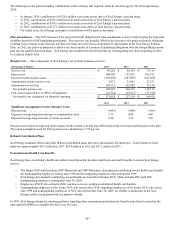
Projected Benefit Payments
The following table lists Xcel Energy’s projected benefit payments for the pension and postretirement benefit plans:
(Thousands of Dollars)
Projected
Pension Benefit
Payments
Gross Projected
Postretirement
Health Care
Benefit Payments
Expected
Medicare Part D
Subsidies
Net Projected
Postretirement
Health Care
Benefit Payments
2014. . . . . . . . . . . . . . . . . . . . . . . . . . . . . . . . . . . . . . . . . . . . $ 313,226 $ 53,516 $ 2,627 $ 50,889
2015. . . . . . . . . . . . . . . . . . . . . . . . . . . . . . . . . . . . . . . . . . . . 266,802 54,576 2,806 51,770
2016. . . . . . . . . . . . . . . . . . . . . . . . . . . . . . . . . . . . . . . . . . . . 267,186 55,965 2,969 52,996
2017. . . . . . . . . . . . . . . . . . . . . . . . . . . . . . . . . . . . . . . . . . . . 269,526 56,513 3,135 53,378
2018. . . . . . . . . . . . . . . . . . . . . . . . . . . . . . . . . . . . . . . . . . . . 272,908 58,181 3,291 54,890
2019-2023 . . . . . . . . . . . . . . . . . . . . . . . . . . . . . . . . . . . . . . . 1,339,764 282,860 18,274 264,586
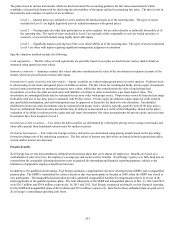
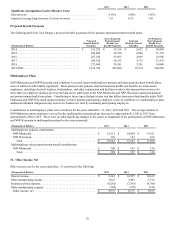
Multiemployer Plans
NSP-Minnesota and NSP-Wisconsin each contribute to several union multiemployer pension and other postretirement benefit plans,
none of which are individually significant. These plans provide pension and postretirement health care benefits to certain union
employees, including electrical workers, boilermakers, and other construction and facilities workers who may perform services for
more than one employer during a given period and do not participate in the NSP-Minnesota and NSP-Wisconsin sponsored pension
and postretirement health care plans. Contributing to these types of plans creates risk that differs from providing benefits under NSP-
Minnesota and NSP-Wisconsin sponsored plans, in that if another participating employer ceases to contribute to a multiemployer plan,
additional unfunded obligations may need to be funded over time by remaining participating employers.
Contributions to multiemployer plans were as follows for the years ended Dec. 31, 2013, 2012 and 2011. The average number of
NSP-Minnesota union employees covered by the multiemployer pension plans increased to approximately 1,100 in 2013 from
approximately 800 in 2012. There were no other significant changes to the nature or magnitude of the participation of NSP-Minnesota
and NSP-Wisconsin in multiemployer plans for the years presented:
(Thousands of Dollars) 2013 2012 2011
Multiemployer pension contributions:
NSP-Minnesota. . . . . . . . . . . . . . . . . . . . . . . . . . . . . . . . . . . . . . . . . . . . . $ 23,515 $ 14,984 $ 17,811
NSP-Wisconsin. . . . . . . . . . . . . . . . . . . . . . . . . . . . . . . . . . . . . . . . . . . . . 130 163 169
Total . . . . . . . . . . . . . . . . . . . . . . . . . . . . . . . . . . . . . . . . . . . . . . . . . . . $ 23,645 $ 15,147 $ 17,980
Multiemployer other postretirement benefit contributions:
NSP-Minnesota. . . . . . . . . . . . . . . . . . . . . . . . . . . . . . . . . . . . . . . . . . . . . $ 390 $ 197 $ 336
Total . . . . . . . . . . . . . . . . . . . . . . . . . . . . . . . . . . . . . . . . . . . . . . . . . . . $ 390 $ 197 $ 336
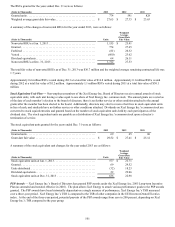
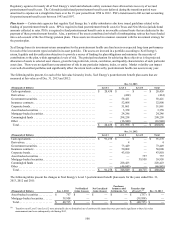
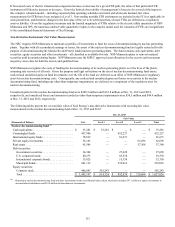
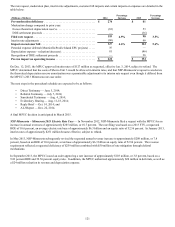
10. Other Income, Net
Other income, net for the years ended Dec. 31 consisted of the following:
(Thousands of Dollars) 2013 2012 2011
Interest income . . . . . . . . . . . . . . . . . . . . . . . . . . . . . . . . . . . . . . . . . . . . . . $ 8,343 $ 10,327 $ 10,639
Other nonoperating income. . . . . . . . . . . . . . . . . . . . . . . . . . . . . . . . . . . . . 3,025 3,483 3,722
Insurance policy expense. . . . . . . . . . . . . . . . . . . . . . . . . . . . . . . . . . . . . . . (8,292)(7,365)(4,785)
Other nonoperating expense . . . . . . . . . . . . . . . . . . . . . . . . . . . . . . . . . . . . (104)(270)(321)
Other income, net . . . . . . . . . . . . . . . . . . . . . . . . . . . . . . . . . . . . . . . . . . . $ 2,972 $ 6,175 $ 9,255