Xcel Energy 2013 Annual Report Download - page 173
Download and view the complete annual report
Please find page 173 of the 2013 Xcel Energy annual report below. You can navigate through the pages in the report by either clicking on the pages listed below, or by using the keyword search tool below to find specific information within the annual report.-
 1
1 -
2
-
3
-
4
-
5
-
6
-
7
-
8
-
9
-
10
-
11
-
12
-
13
-
14
-
15
-
16
-
17
-
18
-
19
-
20
-
21
-
22
-
23
-
24
-
25
-
26
-
27
-
28
-
29
-
30
-
31
-
32
-
33
-
34
-
35
-
36
-
37
-
38
-
39
-
40
-
41
-
42
-
43
-
44
-
45
-
46
-
47
-
48
-
49
-
50
-
51
-
52
-
53
-
54
-
55
-
56
-
57
-
58
-
59
-
60
-
61
-
62
-
63
-
64
-
65
-
66
-
67
-
68
-
69
-
70
-
71
-
72
-
73
-
74
-
75
-
76
-
77
-
78
-
79
-
80
-
81
-
82
-
83
-
84
-
85
-
86
-
87
-
88
-
89
-
90
-
91
-
92
-
93
-
94
-
95
-
96
-
97
-
98
-
99
-
100
-
101
-
102
-
103
-
104
-
105
-
106
-
107
-
108
-
109
-
110
-
111
-
112
-
113
-
114
-
115
-
116
-
117
-
118
-
119
-
120
-
121
-
122
-
123
-
124
-
125
-
126
-
127
-
128
-
129
-
130
-
131
-
132
-
133
-
134
-
135
-
136
-
137
-
138
-
139
-
140
-
141
-
142
-
143
-
144
-
145
-
146
-
147
-
148
-
149
-
150
-
151
-
152
-
153
-
154
-
155
-
156
-
157
-
158
-
159
-
160
-
161
-
162
-
 163
163 -
 164
164 -
 165
165 -
 166
166 -
 167
167 -
 168
168 -
 169
169 -
 170
170 -
 171
171 -
 172
172 -
 173
173 -
 174
174 -
 175
175 -
 176
176 -
 177
177 -
 178
178 -
 179
179 -
 180
180
 |
 |

155
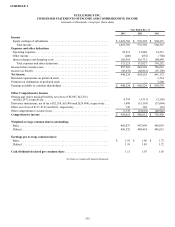
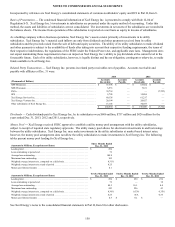
SCHEDULE I
XCEL ENERGY INC.
CONDENSED STATEMENTS OF INCOME AND COMPREHENSIVE INCOME
(amounts in thousands, except per share data)
Year Ended Dec. 31
2013 2012 2011
Income
Equity earnings of subsidiaries . . . . . . . . . . . . . . . . . . . . . . . . . . . . . . . . . . . . . . . . . . $ 1,018,783 $ 976,395 $ 904,315
Total income . . . . . . . . . . . . . . . . . . . . . . . . . . . . . . . . . . . . . . . . . . . . . . . . . . . . . . 1,018,783 976,395 904,315
Expenses and other deductions
Operating expenses . . . . . . . . . . . . . . . . . . . . . . . . . . . . . . . . . . . . . . . . . . . . . . . . . . . 18,513 15,948 14,513
Other income . . . . . . . . . . . . . . . . . . . . . . . . . . . . . . . . . . . . . . . . . . . . . . . . . . . . . . . . (206)(652) (760)
Interest charges and financing costs . . . . . . . . . . . . . . . . . . . . . . . . . . . . . . . . . . . . . . 102,914 116,731 104,499
Total expenses and other deductions. . . . . . . . . . . . . . . . . . . . . . . . . . . . . . . . . . . . 121,221 132,027 118,252
Income before income taxes. . . . . . . . . . . . . . . . . . . . . . . . . . . . . . . . . . . . . . . . . . . . . . 897,562 844,368 786,063
Income tax benefit . . . . . . . . . . . . . . . . . . . . . . . . . . . . . . . . . . . . . . . . . . . . . . . . . . . . . (50,672)(60,861) (55,109)
Net income. . . . . . . . . . . . . . . . . . . . . . . . . . . . . . . . . . . . . . . . . . . . . . . . . . . . . . . . . . . 948,234 905,229 841,172
Dividend requirements on preferred stock. . . . . . . . . . . . . . . . . . . . . . . . . . . . . . . . . . . — — 3,534
Premium on redemption of preferred stock . . . . . . . . . . . . . . . . . . . . . . . . . . . . . . . . . . — — 3,260
Earnings available to common shareholders . . . . . . . . . . . . . . . . . . . . . . . . . . . . . . . . . $ 948,234 $ 905,229 $ 834,378
Other Comprehensive Income
Pension and retiree medical benefits, net of tax of $5,897, $(2,331)
and $(2,247), respectively. . . . . . . . . . . . . . . . . . . . . . . . . . . . . . . . . . . . . . . . . . . . . . 4,714 (3,311) (3,205)
Derivative instruments, net of tax of $2,558, $(9,906) and $(24,488), respectively . . . 1,488 (15,503) (37,644)
Other, net of tax of $117, $135 and $(63), respectively. . . . . . . . . . . . . . . . . . . . . . . . . 176 196 (93)
Other comprehensive income (loss). . . . . . . . . . . . . . . . . . . . . . . . . . . . . . . . . . . . . . . . 6,378 (18,618) (40,942)
Comprehensive income . . . . . . . . . . . . . . . . . . . . . . . . . . . . . . . . . . . . . . . . . . . . . . . . $ 954,612 $ 886,611 $ 793,436
Weighted average common shares outstanding:
Basic. . . . . . . . . . . . . . . . . . . . . . . . . . . . . . . . . . . . . . . . . . . . . . . . . . . . . . . . . . . . . . . 496,073 487,899 485,039
Diluted . . . . . . . . . . . . . . . . . . . . . . . . . . . . . . . . . . . . . . . . . . . . . . . . . . . . . . . . . . . . . 496,532 488,434 485,615
Earnings per average common share:
Basic. . . . . . . . . . . . . . . . . . . . . . . . . . . . . . . . . . . . . . . . . . . . . . . . . . . . . . . . . . . . . . . $ 1.91 $ 1.86 $ 1.72
Diluted . . . . . . . . . . . . . . . . . . . . . . . . . . . . . . . . . . . . . . . . . . . . . . . . . . . . . . . . . . . . . 1.91 1.85 1.72
Cash dividends declared per common share . . . . . . . . . . . . . . . . . . . . . . . . . . . . . . . 1.11 1.07 1.03
See Notes to Condensed Financial Statements