Xcel Energy 2013 Annual Report Download - page 77
Download and view the complete annual report
Please find page 77 of the 2013 Xcel Energy annual report below. You can navigate through the pages in the report by either clicking on the pages listed below, or by using the keyword search tool below to find specific information within the annual report.-
 1
1 -
2
-
3
-
4
-
5
-
6
-
7
-
8
-
9
-
10
-
11
-
12
-
13
-
14
-
15
-
16
-
17
-
18
-
19
-
20
-
21
-
22
-
23
-
24
-
25
-
26
-
27
-
28
-
29
-
30
-
31
-
32
-
33
-
34
-
35
-
36
-
37
-
38
-
39
-
40
-
41
-
42
-
43
-
44
-
45
-
46
-
47
-
48
-
49
-
50
-
51
-
52
-
53
-
54
-
55
-
56
-
57
-
58
-
59
-
60
-
61
-
62
-
63
-
64
-
65
-
66
-
 67
67 -
 68
68 -
 69
69 -
 70
70 -
 71
71 -
 72
72 -
 73
73 -
 74
74 -
 75
75 -
 76
76 -
 77
77 -
 78
78 -
 79
79 -
 80
80 -
 81
81 -
 82
82 -
 83
83 -
 84
84 -
 85
85 -
 86
86 -
 87
87 -
88
-
89
-
90
-
91
-
92
-
93
-
94
-
95
-
96
-
97
-
98
-
99
-
100
-
101
-
102
-
103
-
104
-
105
-
106
-
107
-
108
-
109
-
110
-
111
-
112
-
113
-
114
-
115
-
116
-
117
-
118
-
119
-
120
-
121
-
122
-
123
-
124
-
125
-
126
-
127
-
128
-
129
-
130
-
131
-
132
-
133
-
134
-
135
-
136
-
137
-
138
-
139
-
140
-
141
-
142
-
143
-
144
-
145
-
146
-
147
-
148
-
149
-
150
-
151
-
152
-
153
-
154
-
155
-
156
-
157
-
158
-
159
-
160
-
161
-
162
-
163
-
164
-
165
-
166
-
167
-
168
-
169
-
170
-
171
-
172
-
173
-
174
-
175
-
176
-
177
-
178
-
179
-
180
 |
 |

59
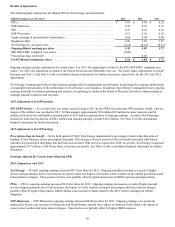
Income Taxes — Income tax expense increased $33.8 million for 2013 compared with 2012. The increase in income tax expense was
primarily due to higher pretax earnings in 2013, a tax benefit for a carryback in 2012 and for the restoration in 2012 of a portion of the
tax benefit associated with federal subsidies for prescription drug plans that was previously written off in 2010. These were partially
offset in 2013 by a tax benefit for a carryback claim related to 2013, research and experimentation credits and increased permanent
plant-related reductions. The ETR was 33.8 percent for 2013 compared with 33.2 percent for 2012. The higher ETR for 2013 was
primarily due to the adjustments referenced above. See Note 6 to the consolidated financial statements for further discussion.
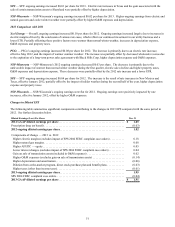
Income tax expense decreased $18.1 million for 2012 compared with 2011. The decrease in income tax expense was primarily due to
a tax benefit associated with a carryback and a tax benefit related to the restoration of a portion of the tax benefit written off in 2010
associated with federal subsidies for prescription drug plans. As a result, Xcel Energy recognized tax benefits of approximately $14.9
million for the carryback and $17 million for the tax benefit associated with the federal subsidies. These were partially offset by
higher pretax income in 2012. The ETR was 33.2 percent for 2012, compared with 35.8 percent for 2011. The lower ETR for 2012
was primarily due to the adjustments referenced above. The ETR would have been 35.6 percent for 2012 without these tax benefits.
Premium on Redemption of Preferred Stock — Xcel Energy Inc. redeemed all series of its preferred stock on Oct. 31, 2011, at an
aggregate purchase price of $108 million, plus accrued dividends. As such, the redemption premium of $3.3 million and accrued
dividends are reflected as reductions to earnings available to common shareholders for 2011.
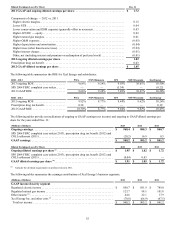
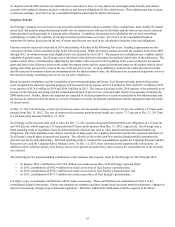
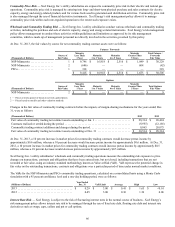
Xcel Energy Inc. and Other Results
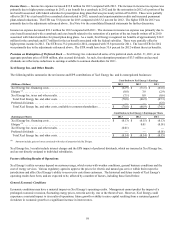
The following tables summarize the net income and EPS contributions of Xcel Energy Inc. and its nonregulated businesses:
Contribution to Xcel Energy’s Earnings
(Millions of Dollars) 2013 2012 2011
Xcel Energy Inc. financing costs . . . . . . . . . . . . . . . . . . . . . . . . . . . . . . . . . . . . . . . . . . . $ (62.9) $ (71.5) $ (63.8)
Eloigne (a) . . . . . . . . . . . . . . . . . . . . . . . . . . . . . . . . . . . . . . . . . . . . . . . . . . . . . . . . . . . . . (0.8) 3.8 (2.9)
Xcel Energy Inc. taxes and other results . . . . . . . . . . . . . . . . . . . . . . . . . . . . . . . . . . . . . (7.1) 0.8 (0.6)
Total Xcel Energy Inc. and other costs . . . . . . . . . . . . . . . . . . . . . . . . . . . . . . . . . . . . . (70.8)(66.9) (67.3)
Preferred dividends . . . . . . . . . . . . . . . . . . . . . . . . . . . . . . . . . . . . . . . . . . . . . . . . . . . . . — — (6.8)
Total Xcel Energy Inc. and other costs, available to common shareholders. . . . . . . . . $ (70.8) $ (66.9) $ (74.1)
Contribution to Xcel Energy’s Earnings per Share
(Earnings per Share) 2013 2012 2011
Xcel Energy Inc. financing costs . . . . . . . . . . . . . . . . . . . . . . . . . . . . . . . . . . . . . . . . . . . $ (0.13) $ (0.15) $ (0.13)
Eloigne (a) . . . . . . . . . . . . . . . . . . . . . . . . . . . . . . . . . . . . . . . . . . . . . . . . . . . . . . . . . . . . . — 0.01 (0.01)
Xcel Energy Inc. taxes and other results . . . . . . . . . . . . . . . . . . . . . . . . . . . . . . . . . . . . . (0.01) — —
Preferred dividends . . . . . . . . . . . . . . . . . . . . . . . . . . . . . . . . . . . . . . . . . . . . . . . . . . . . . — — (0.01)
Total Xcel Energy Inc. and other costs . . . . . . . . . . . . . . . . . . . . . . . . . . . . . . . . . . . . . $ (0.14) $ (0.14) $ (0.15)
(a) Amounts include gains or losses associated with sales of properties held by Eloigne.
Xcel Energy Inc.’s results include interest charges and the EPS impact of preferred dividends, which are incurred at Xcel Energy Inc.
and are not directly assigned to individual subsidiaries.
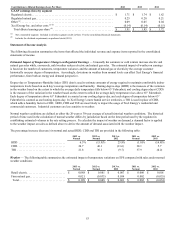
Factors Affecting Results of Operations
Xcel Energy’s utility revenues depend on customer usage, which varies with weather conditions, general business conditions and the
cost of energy services. Various regulatory agencies approve the prices for electric and natural gas service within their respective
jurisdictions and affect Xcel Energy’s ability to recover its costs from customers. The historical and future trends of Xcel Energy’s
operating results have been, and are expected to be, affected by a number of factors, including those listed below.
General Economic Conditions
Economic conditions may have a material impact on Xcel Energy’s operating results. Management cannot predict the impact of a
prolonged economic recession, fluctuating energy prices, terrorist activity, war or the threat of war. However, Xcel Energy could
experience a material impact to its results of operations, future growth or ability to raise capital resulting from a sustained general
slowdown in economic growth or a significant increase in interest rates.