Xcel Energy 2013 Annual Report Download - page 164
Download and view the complete annual report
Please find page 164 of the 2013 Xcel Energy annual report below. You can navigate through the pages in the report by either clicking on the pages listed below, or by using the keyword search tool below to find specific information within the annual report.-
 1
1 -
2
-
3
-
4
-
5
-
6
-
7
-
8
-
9
-
10
-
11
-
12
-
13
-
14
-
15
-
16
-
17
-
18
-
19
-
20
-
21
-
22
-
23
-
24
-
25
-
26
-
27
-
28
-
29
-
30
-
31
-
32
-
33
-
34
-
35
-
36
-
37
-
38
-
39
-
40
-
41
-
42
-
43
-
44
-
45
-
46
-
47
-
48
-
49
-
50
-
51
-
52
-
53
-
54
-
55
-
56
-
57
-
58
-
59
-
60
-
61
-
62
-
63
-
64
-
65
-
66
-
67
-
68
-
69
-
70
-
71
-
72
-
73
-
74
-
75
-
76
-
77
-
78
-
79
-
80
-
81
-
82
-
83
-
84
-
85
-
86
-
87
-
88
-
89
-
90
-
91
-
92
-
93
-
94
-
95
-
96
-
97
-
98
-
99
-
100
-
101
-
102
-
103
-
104
-
105
-
106
-
107
-
108
-
109
-
110
-
111
-
112
-
113
-
114
-
115
-
116
-
117
-
118
-
119
-
120
-
121
-
122
-
123
-
124
-
125
-
126
-
127
-
128
-
129
-
130
-
131
-
132
-
133
-
134
-
135
-
136
-
137
-
138
-
139
-
140
-
141
-
142
-
143
-
144
-
145
-
146
-
147
-
148
-
149
-
150
-
151
-
152
-
153
-
 154
154 -
 155
155 -
 156
156 -
 157
157 -
 158
158 -
 159
159 -
 160
160 -
 161
161 -
 162
162 -
 163
163 -
 164
164 -
 165
165 -
 166
166 -
 167
167 -
 168
168 -
 169
169 -
 170
170 -
 171
171 -
 172
172 -
 173
173 -
 174
174 -
175
-
176
-
177
-
178
-
179
-
180
 |
 |

146
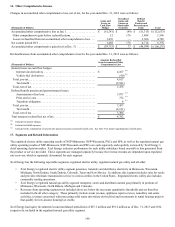
16. Other Comprehensive Income
Changes in accumulated other comprehensive loss, net of tax, for the year ended Dec. 31, 2013 were as follows:
(Thousands of Dollars)
Gains and
Losses on
Cash Flow
Hedges
Unrealized
Gains and
Losses on
Marketable
Securities
Defined
Benefit
Pension and
Postretirement
Items Total
Accumulated other comprehensive loss at Jan. 1 . . . . . . . . . . . . . . . . . . . . $ (61,241) $ (99) $ (51,313) $ (112,653)
Other comprehensive gain before reclassifications. . . . . . . . . . . . . . . . . . 12 176 1,408 1,596
Losses reclassified from net accumulated other comprehensive loss. . . . 1,476 — 3,306 4,782
Net current period OCI . . . . . . . . . . . . . . . . . . . . . . . . . . . . . . . . . . . . . . . . 1,488 176 4,714 6,378
Accumulated other comprehensive gain (loss) at Dec. 31 . . . . . . . . . . . . . $ (59,753) $ 77 $ (46,599) $ (106,275)
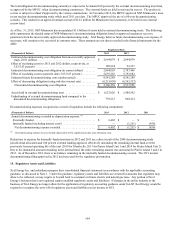
Reclassifications from accumulated other comprehensive loss for the year ended Dec. 31, 2013 were as follows:
(Thousands of Dollars)
Amounts Reclassified
from Accumulated Other
Comprehensive Loss
(Gains) losses on cash flow hedges:
Interest rate derivatives . . . . . . . . . . . . . . . . . . . . . . . . . . . . . . . . . . . . $ 4,107 (a)
Vehicle fuel derivatives . . . . . . . . . . . . . . . . . . . . . . . . . . . . . . . . . . . . (90)(b)
Total, pre-tax. . . . . . . . . . . . . . . . . . . . . . . . . . . . . . . . . . . . . . . . . . . . . . . 4,017
Tax benefit . . . . . . . . . . . . . . . . . . . . . . . . . . . . . . . . . . . . . . . . . . . . . . (2,541)
Total, net of tax. . . . . . . . . . . . . . . . . . . . . . . . . . . . . . . . . . . . . . . . . . . . . 1,476
Defined benefit pension and postretirement losses:
Amortization of net loss. . . . . . . . . . . . . . . . . . . . . . . . . . . . . . . . . . . . 7,077 (c)
Prior service cost . . . . . . . . . . . . . . . . . . . . . . . . . . . . . . . . . . . . . . . . . 372 (c)
Transition obligation . . . . . . . . . . . . . . . . . . . . . . . . . . . . . . . . . . . . . . 8 (c)
Total, pre-tax. . . . . . . . . . . . . . . . . . . . . . . . . . . . . . . . . . . . . . . . . . . . . . . 7,457
Tax benefit . . . . . . . . . . . . . . . . . . . . . . . . . . . . . . . . . . . . . . . . . . . . . . (4,151)
Total, net of tax. . . . . . . . . . . . . . . . . . . . . . . . . . . . . . . . . . . . . . . . . . . . . 3,306
Total amounts reclassified, net of tax . . . . . . . . . . . . . . . . . . . . . . . . . . . . . $ 4,782
(a) Included in interest charges.
(b) Included in O&M expenses.
(c) Included in the computation of net periodic pension and post retirement benefit costs. See Note 9 for details regarding these benefit plans.
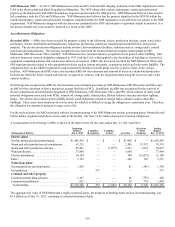
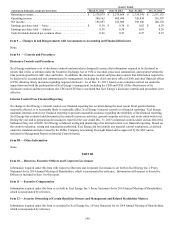
17. Segments and Related Information
The regulated electric utility operating results of NSP-Minnesota, NSP-Wisconsin, PSCo and SPS, as well as the regulated natural gas
utility operating results of NSP-Minnesota, NSP-Wisconsin and PSCo are each separately and regularly reviewed by Xcel Energy’s
chief operating decision maker. Xcel Energy evaluates performance by each utility subsidiary based on profit or loss generated from
the product or service provided. These segments are managed separately because the revenue streams are dependent upon regulated
rate recovery, which is separately determined for each segment.
Xcel Energy has the following reportable segments: regulated electric utility, regulated natural gas utility and all other.
• Xcel Energy’s regulated electric utility segment generates, transmits and distributes electricity in Minnesota, Wisconsin,
Michigan, North Dakota, South Dakota, Colorado, Texas and New Mexico. In addition, this segment includes sales for resale
and provides wholesale transmission service to various entities in the United States. Regulated electric utility also includes
commodity trading operations.
• Xcel Energy’s regulated natural gas utility segment transports, stores and distributes natural gas primarily in portions of
Minnesota, Wisconsin, North Dakota, Michigan and Colorado.
• Revenues from operating segments not included above are below the necessary quantitative thresholds and are therefore
included in the all other category. Those primarily include steam revenue, appliance repair services, nonutility real estate
activities, revenues associated with processing solid waste into refuse-derived fuel and investments in rental housing projects
that qualify for low-income housing tax credits.
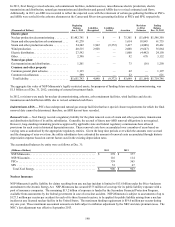
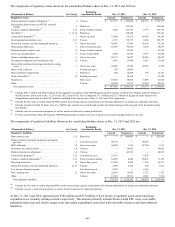
Xcel Energy had equity investments in unconsolidated subsidiaries of $87.1 million and $91.2 million as of Dec. 31, 2013 and 2012,
respectively, included in the regulated natural gas utility segment.