Xcel Energy 2013 Annual Report Download - page 123
Download and view the complete annual report
Please find page 123 of the 2013 Xcel Energy annual report below. You can navigate through the pages in the report by either clicking on the pages listed below, or by using the keyword search tool below to find specific information within the annual report.-
 1
1 -
2
-
3
-
4
-
5
-
6
-
7
-
8
-
9
-
10
-
11
-
12
-
13
-
14
-
15
-
16
-
17
-
18
-
19
-
20
-
21
-
22
-
23
-
24
-
25
-
26
-
27
-
28
-
29
-
30
-
31
-
32
-
33
-
34
-
35
-
36
-
37
-
38
-
39
-
40
-
41
-
42
-
43
-
44
-
45
-
46
-
47
-
48
-
49
-
50
-
51
-
52
-
53
-
54
-
55
-
56
-
57
-
58
-
59
-
60
-
61
-
62
-
63
-
64
-
65
-
66
-
67
-
68
-
69
-
70
-
71
-
72
-
73
-
74
-
75
-
76
-
77
-
78
-
79
-
80
-
81
-
82
-
83
-
84
-
85
-
86
-
87
-
88
-
89
-
90
-
91
-
92
-
93
-
94
-
95
-
96
-
97
-
98
-
99
-
100
-
101
-
102
-
103
-
104
-
105
-
106
-
107
-
108
-
109
-
110
-
111
-
112
-
 113
113 -
 114
114 -
 115
115 -
 116
116 -
 117
117 -
 118
118 -
 119
119 -
 120
120 -
 121
121 -
 122
122 -
 123
123 -
 124
124 -
 125
125 -
 126
126 -
 127
127 -
 128
128 -
 129
129 -
 130
130 -
 131
131 -
 132
132 -
 133
133 -
134
-
135
-
136
-
137
-
138
-
139
-
140
-
141
-
142
-
143
-
144
-
145
-
146
-
147
-
148
-
149
-
150
-
151
-
152
-
153
-
154
-
155
-
156
-
157
-
158
-
159
-
160
-
161
-
162
-
163
-
164
-
165
-
166
-
167
-
168
-
169
-
170
-
171
-
172
-
173
-
174
-
175
-
176
-
177
-
178
-
179
-
180
 |
 |

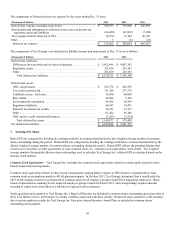
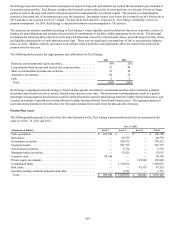
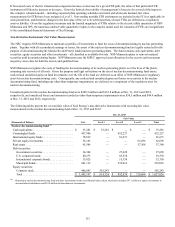
105
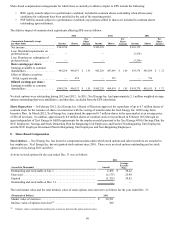
Dec. 31, 2012
(Thousands of Dollars) Level 1 Level 2 Level 3 Total
Cash equivalents . . . . . . . . . . . . . . . . . . . . . . . . . . . . . . . . . . . . . . . . . . . . . $ 164,096 $ — $ — $ 164,096
Derivatives. . . . . . . . . . . . . . . . . . . . . . . . . . . . . . . . . . . . . . . . . . . . . . . . . . — 12,955 — 12,955
Government securities. . . . . . . . . . . . . . . . . . . . . . . . . . . . . . . . . . . . . . . . . — 298,141 — 298,141
Corporate bonds. . . . . . . . . . . . . . . . . . . . . . . . . . . . . . . . . . . . . . . . . . . . . . — 622,597 — 622,597
Asset-backed securities . . . . . . . . . . . . . . . . . . . . . . . . . . . . . . . . . . . . . . . . — — 14,639 14,639
Mortgage-backed securities. . . . . . . . . . . . . . . . . . . . . . . . . . . . . . . . . . . . . — — 39,904 39,904
Common stock. . . . . . . . . . . . . . . . . . . . . . . . . . . . . . . . . . . . . . . . . . . . . . . 73,247 — — 73,247
Private equity investments. . . . . . . . . . . . . . . . . . . . . . . . . . . . . . . . . . . . . . — — 158,498 158,498
Commingled funds . . . . . . . . . . . . . . . . . . . . . . . . . . . . . . . . . . . . . . . . . . . — 1,524,563 — 1,524,563
Real estate . . . . . . . . . . . . . . . . . . . . . . . . . . . . . . . . . . . . . . . . . . . . . . . . . . — — 64,597 64,597
Securities lending collateral obligation and other . . . . . . . . . . . . . . . . . . . . — (29,454) — (29,454)
Total. . . . . . . . . . . . . . . . . . . . . . . . . . . . . . . . . . . . . . . . . . . . . . . . . . . . . . $ 237,343 $ 2,428,802 $ 277,638 $ 2,943,783
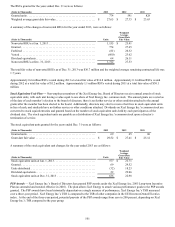
The following tables present the changes in Xcel Energy’s Level 3 pension plan assets for the years ended Dec. 31, 2013, 2012 and
2011:
(Thousands of Dollars) Jan. 1, 2013 Net Realized
Gains (Losses) Net Unrealized
Gains (Losses)
Purchases,
Issuances and
Settlements, Net Transfers Out
of Level 3 (a) Dec. 31, 2013
Asset-backed securities . . . . . . . . . . $ 14,639 $ — $ — $ — $ (14,639) $ —
Mortgage-backed securities. . . . . . . 39,904 — — — (39,904) —
Private equity investments. . . . . . . . 158,498 22,058 (24,335)(3,372) — 152,849
Real estate . . . . . . . . . . . . . . . . . . . . 64,597 (2,659) 8,690 9,317 (32,392) 47,553
Total. . . . . . . . . . . . . . . . . . . . . . . . $ 277,638 $ 19,399 $ (15,645) $ 5,945 $ (86,935) $ 200,402
(a) Transfers out of Level 3 into Level 2 were principally due to diminished use of unobservable inputs that were previously significant to these fair value
measurements and were subsequently sold during 2013.
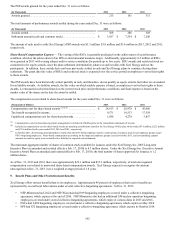
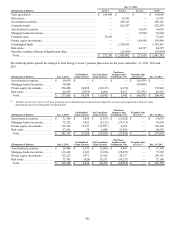
(Thousands of Dollars) Jan. 1, 2012 Net Realized
Gains (Losses) Net Unrealized
Gains (Losses)
Purchases,
Issuances and
Settlements, Net Transfers Out
of Level 3 Dec. 31, 2012
Asset-backed securities . . . . . . . . . . $ 31,368 $ 3,886 $ (5,363) $ (15,252) $ — $ 14,639
Mortgage-backed securities. . . . . . . 73,522 1,822 (2,127)(33,313) — 39,904
Private equity investments. . . . . . . . 159,363 17,537 (22,587) 4,185 — 158,498
Real estate . . . . . . . . . . . . . . . . . . . . 37,106 19 6,048 21,424 — 64,597
Total. . . . . . . . . . . . . . . . . . . . . . . . $ 301,359 $ 23,264 $ (24,029) $ (22,956) $ — $ 277,638
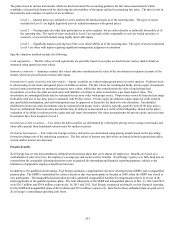
(Thousands of Dollars) Jan. 1, 2011 Net Realized
Gains (Losses) Net Unrealized
Gains (Losses)
Purchases,
Issuances and
Settlements, Net Transfers Out
of Level 3 Dec. 31, 2011
Asset-backed securities . . . . . . . . . . $ 26,986 $ 2,391 $ (2,504) $ 4,495 $ — $ 31,368
Mortgage-backed securities. . . . . . . 113,418 1,103 (5,926)(35,073) — 73,522
Private equity investments. . . . . . . . 122,223 3,971 12,412 20,757 — 159,363
Real estate . . . . . . . . . . . . . . . . . . . . 73,701 (629) 20,271 (56,237) — 37,106
Total. . . . . . . . . . . . . . . . . . . . . . . . $ 336,328 $ 6,836 $ 24,253 $ (66,058) $ — $ 301,359