Xcel Energy 2013 Annual Report Download - page 64
Download and view the complete annual report
Please find page 64 of the 2013 Xcel Energy annual report below. You can navigate through the pages in the report by either clicking on the pages listed below, or by using the keyword search tool below to find specific information within the annual report.-
 1
1 -
2
-
3
-
4
-
5
-
6
-
7
-
8
-
9
-
10
-
11
-
12
-
13
-
14
-
15
-
16
-
17
-
18
-
19
-
20
-
21
-
22
-
23
-
24
-
25
-
26
-
27
-
28
-
29
-
30
-
31
-
32
-
33
-
34
-
35
-
36
-
37
-
38
-
39
-
40
-
41
-
42
-
43
-
44
-
45
-
46
-
47
-
48
-
49
-
50
-
51
-
52
-
53
-
 54
54 -
 55
55 -
 56
56 -
 57
57 -
 58
58 -
 59
59 -
 60
60 -
 61
61 -
 62
62 -
 63
63 -
 64
64 -
 65
65 -
 66
66 -
 67
67 -
 68
68 -
 69
69 -
 70
70 -
 71
71 -
 72
72 -
 73
73 -
 74
74 -
75
-
76
-
77
-
78
-
79
-
80
-
81
-
82
-
83
-
84
-
85
-
86
-
87
-
88
-
89
-
90
-
91
-
92
-
93
-
94
-
95
-
96
-
97
-
98
-
99
-
100
-
101
-
102
-
103
-
104
-
105
-
106
-
107
-
108
-
109
-
110
-
111
-
112
-
113
-
114
-
115
-
116
-
117
-
118
-
119
-
120
-
121
-
122
-
123
-
124
-
125
-
126
-
127
-
128
-
129
-
130
-
131
-
132
-
133
-
134
-
135
-
136
-
137
-
138
-
139
-
140
-
141
-
142
-
143
-
144
-
145
-
146
-
147
-
148
-
149
-
150
-
151
-
152
-
153
-
154
-
155
-
156
-
157
-
158
-
159
-
160
-
161
-
162
-
163
-
164
-
165
-
166
-
167
-
168
-
169
-
170
-
171
-
172
-
173
-
174
-
175
-
176
-
177
-
178
-
179
-
180
 |
 |
46
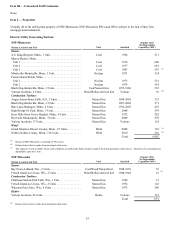
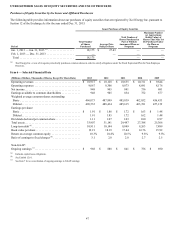
2012 High Low Dividends
First quarter . . . . . . . . . . . . . . . . . . . . . . . . . . . . . . . . . . . . . . . . . . . . . . . . . . . . . . . . . . . . . $ 27.93 $ 25.92 $ 0.2600
Second quarter. . . . . . . . . . . . . . . . . . . . . . . . . . . . . . . . . . . . . . . . . . . . . . . . . . . . . . . . . . . 29.12 25.89 0.2700
Third quarter . . . . . . . . . . . . . . . . . . . . . . . . . . . . . . . . . . . . . . . . . . . . . . . . . . . . . . . . . . . . 29.92 27.25 0.2700
Fourth quarter . . . . . . . . . . . . . . . . . . . . . . . . . . . . . . . . . . . . . . . . . . . . . . . . . . . . . . . . . . . 28.34 25.84 0.2700
Xcel Energy Inc.’s Articles of Incorporation place restrictions on the amount of common stock dividends it can pay when preferred
stock is outstanding. As there was no preferred stock outstanding at any time during the year ended Dec. 31, 2013, the restrictions did
not place any effective limit on Xcel Energy Inc.’s ability to pay dividends. See Item 7 and Note 4 to the consolidated financial
statements for further discussion of Xcel Energy Inc.’s dividend policy.
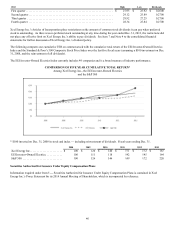
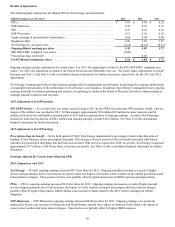
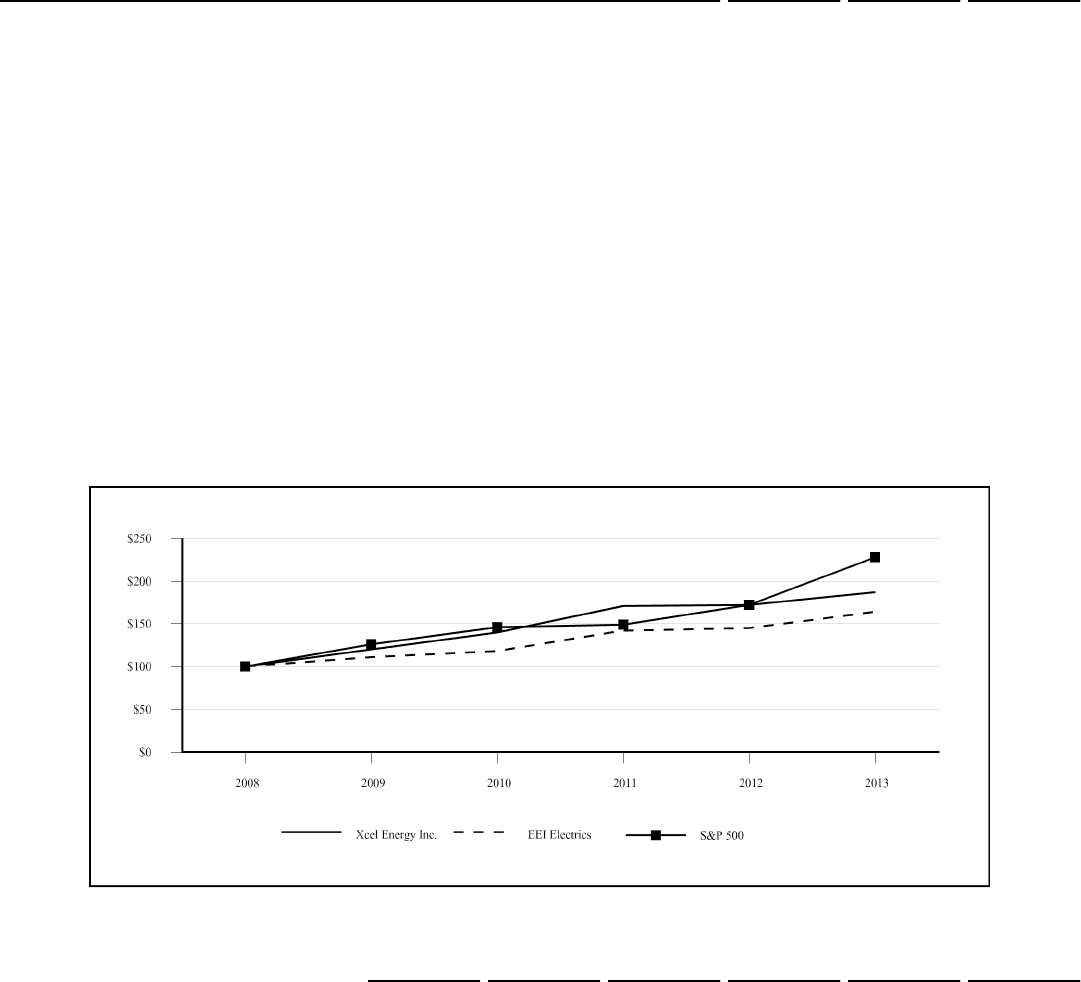
The following compares our cumulative TSR on common stock with the cumulative total return of the EEI Investor-Owned Electrics
Index and the Standard & Poor’s 500 Composite Stock Price Index over the last five fiscal years (assuming a $100 investment on Dec.
31, 2008, and the reinvestment of all dividends).
The EEI Investor-Owned Electrics Index currently includes 49 companies and is a broad measure of industry performance.
COMPARISON OF FIVE YEAR CUMULATIVE TOTAL RETURN*
Among Xcel Energy Inc., the EEI Investor-Owned Electrics
and the S&P 500
* $100 invested on Dec. 31, 2008 in stock and index — including reinvestment of dividends. Fiscal years ending Dec. 31.
2008 2009 2010 2011 2012 2013
Xcel Energy Inc. . . . . . . . . . . . . . . . . . . . . . . $ 100 $ 120 $ 140 $ 171 $ 172 $ 187
EEI Investor-Owned Electrics. . . . . . . . . . . . 100 111 118 142 145 164
S&P 500 . . . . . . . . . . . . . . . . . . . . . . . . . . . . 100 126 146 149 172 228
Securities Authorized for Issuance Under Equity Compensation Plans
Information required under Item 5 — Securities Authorized for Issuance Under Equity Compensation Plans is contained in Xcel
Energy Inc.’s Proxy Statement for its 2014 Annual Meeting of Shareholders, which is incorporated by reference.