Xcel Energy 2013 Annual Report Download - page 30
Download and view the complete annual report
Please find page 30 of the 2013 Xcel Energy annual report below. You can navigate through the pages in the report by either clicking on the pages listed below, or by using the keyword search tool below to find specific information within the annual report.-
 1
1 -
2
-
3
-
4
-
5
-
6
-
7
-
8
-
9
-
10
-
11
-
12
-
13
-
14
-
15
-
16
-
17
-
18
-
19
-
 20
20 -
 21
21 -
 22
22 -
 23
23 -
 24
24 -
 25
25 -
 26
26 -
 27
27 -
 28
28 -
 29
29 -
 30
30 -
 31
31 -
 32
32 -
 33
33 -
 34
34 -
 35
35 -
 36
36 -
 37
37 -
 38
38 -
 39
39 -
 40
40 -
41
-
42
-
43
-
44
-
45
-
46
-
47
-
48
-
49
-
50
-
51
-
52
-
53
-
54
-
55
-
56
-
57
-
58
-
59
-
60
-
61
-
62
-
63
-
64
-
65
-
66
-
67
-
68
-
69
-
70
-
71
-
72
-
73
-
74
-
75
-
76
-
77
-
78
-
79
-
80
-
81
-
82
-
83
-
84
-
85
-
86
-
87
-
88
-
89
-
90
-
91
-
92
-
93
-
94
-
95
-
96
-
97
-
98
-
99
-
100
-
101
-
102
-
103
-
104
-
105
-
106
-
107
-
108
-
109
-
110
-
111
-
112
-
113
-
114
-
115
-
116
-
117
-
118
-
119
-
120
-
121
-
122
-
123
-
124
-
125
-
126
-
127
-
128
-
129
-
130
-
131
-
132
-
133
-
134
-
135
-
136
-
137
-
138
-
139
-
140
-
141
-
142
-
143
-
144
-
145
-
146
-
147
-
148
-
149
-
150
-
151
-
152
-
153
-
154
-
155
-
156
-
157
-
158
-
159
-
160
-
161
-
162
-
163
-
164
-
165
-
166
-
167
-
168
-
169
-
170
-
171
-
172
-
173
-
174
-
175
-
176
-
177
-
178
-
179
-
180
 |
 |

12
In the 2013 Minnesota electric rate case final order, the MPUC initiated an investigation to determine whether the costs in excess of
those included in the CON for NSP-Minnesota’s Monticello LCM/EPU project were prudent. In October 2013, NSP-Minnesota filed
a summary report and witness testimony to further support the change in and prudence of the incurred costs. The filing indicated the
increase in costs was primarily attributable to three factors; (1) the original estimate was based on a high level conceptual design and
the project scope increased as the actual conditions of the plant were incorporated into the design; (2) implementation difficulties,
including the amount of work that occurred in confined and radioactive or electrically sensitive spaces and NSP-Minnesota’s and its
vendor’s ability to attract and retain experienced workers; and (3) additional NRC licensing related requests over the five-plus year
application process. The prudence investigation is currently scheduled to conclude in the fourth quarter of 2014.
In NSP-Wisconsin’s recent rate case for 2014 rates, the PSCW ordered NSP-Wisconsin to defer cost recovery of $4.1 million, the
portion of the interchange agreement amounts from NSP-Minnesota relating to the Monticello EPU project costs until the MPUC
completes its prudence review.
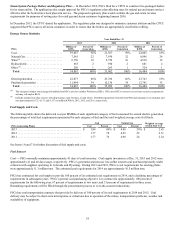
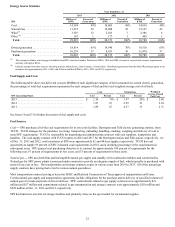
Energy Source Statistics
Year Ended Dec. 31
2013 2012 2011
NSP System Millions of
KWh Percent of
Generation Millions of
KWh Percent of
Generation Millions of
KWh Percent of
Generation
Coal. . . . . . . . . . . . . . . . . . . . . . . . . . . . . . . . 15,844 36% 16,023 35% 20,131 44%
Nuclear . . . . . . . . . . . . . . . . . . . . . . . . . . . . . 12,161 28 13,231 29 13,332 29
Natural Gas . . . . . . . . . . . . . . . . . . . . . . . . . . 5,550 13 6,200 13 3,016 7
Wind (a) . . . . . . . . . . . . . . . . . . . . . . . . . . . . . 5,481 13 5,443 12 4,312 9
Hydroelectric. . . . . . . . . . . . . . . . . . . . . . . . . 3,223 7 3,193 7 3,444 8
Other (b) . . . . . . . . . . . . . . . . . . . . . . . . . . . . . 1,323 3 1,617 4 1,453 3
Total . . . . . . . . . . . . . . . . . . . . . . . . . . . . . . 43,582 100% 45,707 100% 45,688 100%
Owned generation . . . . . . . . . . . . . . . . . . . . . 29,249 67% 31,365 69% 31,668 69%
Purchased generation . . . . . . . . . . . . . . . . . . 14,333 33 14,342 31 14,020 31
Total . . . . . . . . . . . . . . . . . . . . . . . . . . . . . . 43,582 100% 45,707 100% 45,688 100%
(a) This category includes wind energy de-bundled from RECs and also includes Windsource RECs. The NSP System uses RECs to meet or exceed state resource
requirements and may sell surplus RECs.
(b) Includes energy from other sources, including solar, biomass, oil and refuse. Distributed generation from the Solar*Rewards program is not included, and was
approximately 0.008, 0.006, and 0.003 net million KWh for 2013, 2012, and 2011, respectively.
Fuel Supply and Costs
The following table shows the delivered cost per MMBtu of each significant category of fuel consumed for owned electric generation,
the percentage of total fuel requirements represented by each category of fuel and the total weighted average cost of all fuels.
Coal (a) Nuclear Natural Gas Weighted
Average
Owned Fuel
Cost
NSP System Generating Plants Cost Percent Cost Percent Cost Percent
2013 . . . . . . . . . . . . . . . . . . . . . . . . . . . . $ 2.20 49% $ 0.95 40% $ 5.08 11% $ 2.03
2012 . . . . . . . . . . . . . . . . . . . . . . . . . . . . 2.13 47 0.90 42 4.21 11 1.88
2011 . . . . . . . . . . . . . . . . . . . . . . . . . . . . 2.06 55 0.89 40 6.56 5 1.82
(a) Includes refuse-derived fuel and wood.
See Items 1A and 7 for further discussion of fuel supply and costs.
Fuel Sources
Coal — The NSP System normally maintains approximately 41 days of coal inventory. Coal supply inventories at Dec. 31, 2013 and
2012 were approximately 34 and 39 days usage, respectively. NSP-Minnesota’s generation stations use low-sulfur western coal
purchased primarily under contracts with suppliers operating in Wyoming and Montana. During 2013 and 2012, coal requirements for
the NSP System’s major coal-fired generating plants were approximately 7.3 million tons and 7.2 million tons, respectively. The
estimated coal requirements for 2014 are approximately 9.2 million tons. The coal requirements estimated for 2014 are higher
primarily due to Sherco Unit 3 being placed back in service.