Xcel Energy 2013 Annual Report Download - page 163
Download and view the complete annual report
Please find page 163 of the 2013 Xcel Energy annual report below. You can navigate through the pages in the report by either clicking on the pages listed below, or by using the keyword search tool below to find specific information within the annual report.-
 1
1 -
2
-
3
-
4
-
5
-
6
-
7
-
8
-
9
-
10
-
11
-
12
-
13
-
14
-
15
-
16
-
17
-
18
-
19
-
20
-
21
-
22
-
23
-
24
-
25
-
26
-
27
-
28
-
29
-
30
-
31
-
32
-
33
-
34
-
35
-
36
-
37
-
38
-
39
-
40
-
41
-
42
-
43
-
44
-
45
-
46
-
47
-
48
-
49
-
50
-
51
-
52
-
53
-
54
-
55
-
56
-
57
-
58
-
59
-
60
-
61
-
62
-
63
-
64
-
65
-
66
-
67
-
68
-
69
-
70
-
71
-
72
-
73
-
74
-
75
-
76
-
77
-
78
-
79
-
80
-
81
-
82
-
83
-
84
-
85
-
86
-
87
-
88
-
89
-
90
-
91
-
92
-
93
-
94
-
95
-
96
-
97
-
98
-
99
-
100
-
101
-
102
-
103
-
104
-
105
-
106
-
107
-
108
-
109
-
110
-
111
-
112
-
113
-
114
-
115
-
116
-
117
-
118
-
119
-
120
-
121
-
122
-
123
-
124
-
125
-
126
-
127
-
128
-
129
-
130
-
131
-
132
-
133
-
134
-
135
-
136
-
137
-
138
-
139
-
140
-
141
-
142
-
143
-
144
-
145
-
146
-
147
-
148
-
149
-
150
-
151
-
152
-
 153
153 -
 154
154 -
 155
155 -
 156
156 -
 157
157 -
 158
158 -
 159
159 -
 160
160 -
 161
161 -
 162
162 -
 163
163 -
 164
164 -
 165
165 -
 166
166 -
 167
167 -
 168
168 -
 169
169 -
 170
170 -
 171
171 -
 172
172 -
 173
173 -
174
-
175
-
176
-
177
-
178
-
179
-
180
 |
 |

145
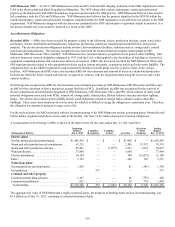
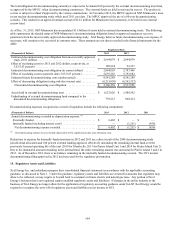
The components of regulatory assets shown on the consolidated balance sheets at Dec. 31, 2013 and 2012 are:
(Thousands of Dollars) See Note(s) Remaining
Amortization Period Dec. 31, 2013 Dec. 31, 2012
Regulatory Assets Current Noncurrent Current Noncurrent
Pension and retiree medical obligations (a) . . . . . . . . . . . . 9 Various $ 118,179 $ 1,192,808 $ 100,713 $ 1,552,375
Recoverable deferred taxes on AFUDC recorded
in plant . . . . . . . . . . . . . . . . . . . . . . . . . . . . . . . . . . . . . . 1 Plant lives — 359,215 — 321,680
Contract valuation adjustments (b). . . . . . . . . . . . . . . . . . . 1, 11 Term of related contract 3,620 153,393 3,775 147,755
Net AROs (c) . . . . . . . . . . . . . . . . . . . . . . . . . . . . . . . . . . . 1, 13, 14 Plant lives — 160,544 — 178,146
Conservation programs (d) . . . . . . . . . . . . . . . . . . . . . . . . . 1 One to six years 55,088 63,275 60,956 84,146
Environmental remediation costs . . . . . . . . . . . . . . . . . . . 1, 13 Various 4,735 119,175 3,986 109,377
Renewable resources and environmental initiatives. . . . . 13 One to four years 46,076 37,858 59,518 38,138
Depreciation differences. . . . . . . . . . . . . . . . . . . . . . . . . . 1 One to seventeen years 10,918 95,844 5,274 50,057
Purchased power contract costs . . . . . . . . . . . . . . . . . . . . 13 Term of related contract — 68,182 — 63,134
Losses on reacquired debt. . . . . . . . . . . . . . . . . . . . . . . . . 4 Term of related debt 5,525 36,534 5,917 42,060
Nuclear refueling outage costs . . . . . . . . . . . . . . . . . . . . . 1 One to two years 86,333 36,477 56,035 22,647
Gas pipeline inspection and remediation costs. . . . . . . . . 12 Various 5,416 33,884 5,416 27,560
Recoverable purchased natural gas and electric energy
costs . . . . . . . . . . . . . . . . . . . . . . . . . . . . . . . . . . . . . . . 1 One to two years 42,288 15,495 32,098 8,340
Sherco Unit 3 deferral. . . . . . . . . . . . . . . . . . . . . . . . . . . . Twenty-one years 503 10,063 — —
State commission adjustments . . . . . . . . . . . . . . . . . . . . . 1 Plant lives 444 14,204 374 12,181
Prairie Island EPU (e). . . . . . . . . . . . . . . . . . . . . . . . . . . . . 12 Pending rate cases — 69,668 — 67,590
Property tax. . . . . . . . . . . . . . . . . . . . . . . . . . . . . . . . . . . . Three years 18,427 30,626 6,005 12,010
Other . . . . . . . . . . . . . . . . . . . . . . . . . . . . . . . . . . . . . . . . . Various 20,249 11,973 12,910 24,833
Total regulatory assets . . . . . . . . . . . . . . . . . . . . . . . . . . $ 417,801 $ 2,509,218 $ 352,977 $ 2,762,029
(a) Includes $303.3 million and $330.3 million for the regulatory recognition of the NSP-Minnesota pension expense of which $23.2 million and $24.3 million is
included in the current asset at Dec. 31, 2013 and 2012, respectively. Also included are $17.7 million and $21.5 million of regulatory assets related to the
nonqualified pension plan of which $2.2 million is included in the current asset at Dec. 31, 2013 and 2012, respectively.
(b) Includes the fair value of certain long-term PPAs used to meet energy capacity requirements and valuation adjustments on natural gas commodity purchases.
(c) Includes amounts recorded for future recovery of AROs, less amounts recovered through nuclear decommissioning accruals and gains from decommissioning
investments.
(d) Includes costs for conservation programs, as well as incentives allowed in certain jurisdictions.
(e) For the canceled Prairie Island EPU project, NSP-Minnesota plans to address recovery of incurred costs in the pending multi-year rate case.
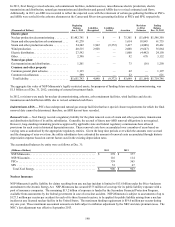
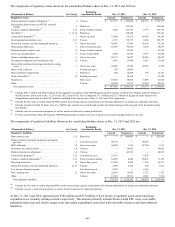
The components of regulatory liabilities shown on the consolidated balance sheets at Dec. 31, 2013 and 2012 are:
(Thousands of Dollars) See Note(s) Remaining
Amortization Period Dec. 31, 2013 Dec. 31, 2012
Regulatory Liabilities Current Noncurrent Current Noncurrent
Plant removal costs . . . . . . . . . . . . . . . . . . . . . . . . . . . . . . 1, 13 Plant lives $ — $ 906,403 $ — $ 922,963
Deferred electric and steam production and natural
gas costs . . . . . . . . . . . . . . . . . . . . . . . . . . . . . . . . . . . . . 1 Less than one year 96,574 — 90,454 —
DOE settlement. . . . . . . . . . . . . . . . . . . . . . . . . . . . . . . . . 12 One to two years 44,208 1,131 22,700 1,131
Investment tax credit deferrals . . . . . . . . . . . . . . . . . . . . . 1, 6 Various — 56,535 — 59,052
Deferred income tax adjustment. . . . . . . . . . . . . . . . . . . . 1, 6 Various — 43,581 — 44,667
Conservation programs (b) . . . . . . . . . . . . . . . . . . . . . . . . . 1, 12 Less than one year 19,531 — 6,292 —
Contract valuation adjustments (a). . . . . . . . . . . . . . . . . . . 1, 11 Term of related contract 54,455 6,849 29,431 11,159
Gain from asset sales . . . . . . . . . . . . . . . . . . . . . . . . . . . . 12 One to three years 12,859 4,568 7,318 10,311
Renewable resources and environmental initiatives. . . . . 12, 13 Various 2,499 1,412 256 1,412
Low income discount program . . . . . . . . . . . . . . . . . . . . . Less than one year 6,229 — 6,164 —
PSCo earnings test . . . . . . . . . . . . . . . . . . . . . . . . . . . . . . 12 One to two years 22,891 19,203 1,732 1,732
Other . . . . . . . . . . . . . . . . . . . . . . . . . . . . . . . . . . . . . . . . . Various 15,523 19,713 4,511 7,512
Total regulatory liabilities . . . . . . . . . . . . . . . . . . . . . . . $ 274,769 $ 1,059,395 $ 168,858 $ 1,059,939
(a) Includes the fair value of certain long-term PPAs used to meet energy capacity requirements and valuation adjustments on natural gas commodity purchases.
(b) Includes costs for conservation programs, as well as incentives allowed in certain jurisdictions.
At Dec. 31, 2013 and 2012, approximately $306 million and $275 million of Xcel Energy’s regulatory assets represented past
expenditures not currently earning a return, respectively. This amount primarily includes Prairie Island EPU costs, recoverable
purchased natural gas and electric energy costs and certain expenditures associated with renewable resources and environmental
initiatives.