Xcel Energy 2013 Annual Report Download - page 76
Download and view the complete annual report
Please find page 76 of the 2013 Xcel Energy annual report below. You can navigate through the pages in the report by either clicking on the pages listed below, or by using the keyword search tool below to find specific information within the annual report.-
 1
1 -
2
-
3
-
4
-
5
-
6
-
7
-
8
-
9
-
10
-
11
-
12
-
13
-
14
-
15
-
16
-
17
-
18
-
19
-
20
-
21
-
22
-
23
-
24
-
25
-
26
-
27
-
28
-
29
-
30
-
31
-
32
-
33
-
34
-
35
-
36
-
37
-
38
-
39
-
40
-
41
-
42
-
43
-
44
-
45
-
46
-
47
-
48
-
49
-
50
-
51
-
52
-
53
-
54
-
55
-
56
-
57
-
58
-
59
-
60
-
61
-
62
-
63
-
64
-
65
-
 66
66 -
 67
67 -
 68
68 -
 69
69 -
 70
70 -
 71
71 -
 72
72 -
 73
73 -
 74
74 -
 75
75 -
 76
76 -
 77
77 -
 78
78 -
 79
79 -
 80
80 -
 81
81 -
 82
82 -
 83
83 -
 84
84 -
 85
85 -
 86
86 -
87
-
88
-
89
-
90
-
91
-
92
-
93
-
94
-
95
-
96
-
97
-
98
-
99
-
100
-
101
-
102
-
103
-
104
-
105
-
106
-
107
-
108
-
109
-
110
-
111
-
112
-
113
-
114
-
115
-
116
-
117
-
118
-
119
-
120
-
121
-
122
-
123
-
124
-
125
-
126
-
127
-
128
-
129
-
130
-
131
-
132
-
133
-
134
-
135
-
136
-
137
-
138
-
139
-
140
-
141
-
142
-
143
-
144
-
145
-
146
-
147
-
148
-
149
-
150
-
151
-
152
-
153
-
154
-
155
-
156
-
157
-
158
-
159
-
160
-
161
-
162
-
163
-
164
-
165
-
166
-
167
-
168
-
169
-
170
-
171
-
172
-
173
-
174
-
175
-
176
-
177
-
178
-
179
-
180
 |
 |

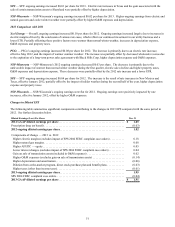
58
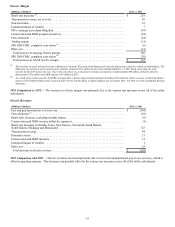
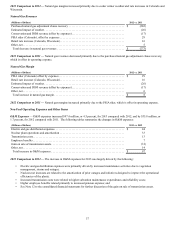
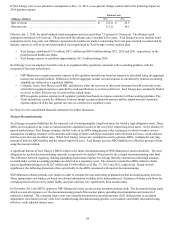
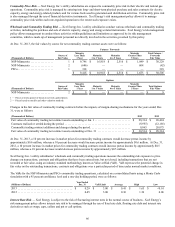
(Millions of Dollars) 2012 vs. 2011
Employee benefits . . . . . . . . . . . . . . . . . . . . . . . . . . . . . . . . . . . . . . . . . . . . . . . . . . . . . . . . . . . . . . . . $ 36
Pipeline system integrity costs . . . . . . . . . . . . . . . . . . . . . . . . . . . . . . . . . . . . . . . . . . . . . . . . . . . . . . 20
SmartGridCity . . . . . . . . . . . . . . . . . . . . . . . . . . . . . . . . . . . . . . . . . . . . . . . . . . . . . . . . . . . . . . . . . . . 11
Prairie Island EPU. . . . . . . . . . . . . . . . . . . . . . . . . . . . . . . . . . . . . . . . . . . . . . . . . . . . . . . . . . . . . . . . 10
Plant generation costs . . . . . . . . . . . . . . . . . . . . . . . . . . . . . . . . . . . . . . . . . . . . . . . . . . . . . . . . . . . . . (17)
Bad debt expense. . . . . . . . . . . . . . . . . . . . . . . . . . . . . . . . . . . . . . . . . . . . . . . . . . . . . . . . . . . . . . . . . (10)
Labor and contract labor . . . . . . . . . . . . . . . . . . . . . . . . . . . . . . . . . . . . . . . . . . . . . . . . . . . . . . . . . . . (2)
Other, net. . . . . . . . . . . . . . . . . . . . . . . . . . . . . . . . . . . . . . . . . . . . . . . . . . . . . . . . . . . . . . . . . . . . . . . (12)
Total increase in O&M expenses . . . . . . . . . . . . . . . . . . . . . . . . . . . . . . . . . . . . . . . . . . . . . . . . . . . $ 36
2012 Comparison to 2011 — The increase in O&M expenses for 2012 was largely driven by the following:
• Higher employee benefits are mainly due to increased pension expenses.
• Higher pipeline system integrity costs relate to increased compliance and inspection initiatives, which in Colorado are
recovered through the pipeline system integrity rider.
• See Note 12 to the consolidated financial statements for further discussion of SmartGridCity and Prairie Island EPU.
• Lower plant generation costs are primarily attributable to fewer plant overhauls in 2012.
Conservation and DSM Program Expenses — Conservation and DSM program expenses decreased $20.9 million, or 7.4 percent, for
2012 compared with 2011. The lower expenses are primarily attributable to lower gas rider rates, as well as the timing of recovery of
electric CIP expenses at NSP-Minnesota. Conservation and DSM program expenses are generally recovered in our major jurisdictions
concurrently through riders and base rates. Overall, the programs are designed to encourage the operating companies and their retail
customers to conserve energy or change energy usage patterns in order to reduce peak demand on the gas or electric system. This, in
turn, reduces the need for additional plant capacity, reduces emissions, serves to achieve other environmental goals as well as reduces
energy costs to participating customers.
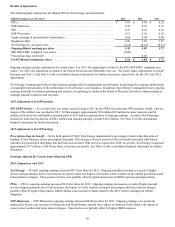
Depreciation and Amortization — Depreciation and amortization increased $51.8 million, or 5.6 percent, for 2013 compared with
2012. The increase is primarily attributable to normal system expansion, which was partially offset by reductions related to the final
rate order received for the 2013 Minnesota electric rate case that reduced depreciation expense by approximately $32 million for 2013.
Depreciation and amortization increased $35.4 million, or 4.0 percent, for 2012 compared with 2011. The increase is primarily due to
a portion of the Monticello EPU going into service in May 2011 at NSP-Minnesota, the Jones Unit 3 going into service in June 2011 at
SPS and normal system expansion across Xcel Energy’s service territories.
Taxes (Other Than Income Taxes) — Taxes (other than income taxes) increased $11.6 million, or 2.8 percent, for 2013 compared
with 2012. The annual increase is due to higher property taxes primarily in Colorado and Texas.
Taxes (other than income taxes) increased $34.1 million, or 9.1 percent, for 2012 compared with 2011. The increases are due to an
increase in property taxes primarily in Minnesota. Higher property taxes in Colorado related to the electric retail business are being
deferred, based on the multi-year rate settlement approved by the CPUC in May 2012.
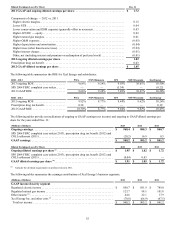
AFUDC, Equity and Debt — AFUDC increased $28.7 million for 2013 compared with 2012. The increase is primarily due to
construction related to the CACJA and the expansion of transmission facilities.
AFUDC increased $18.8 million for 2012, compared with 2011. The increase is primarily due to the expansion of PSCo’s
transmission facilities, additional construction related to the Colorado CACJA and life extension work at the Prairie Island nuclear
generating plant.
Interest Charges — Interest charges decreased $26.4 million, or 4.4 percent, for 2013 compared with 2012. The decrease is primarily
due to refinancings at lower interest rates. This was partially offset by higher long-term debt levels, $4 million of interest associated
with the customer refund at SPS based on the August 2013 FERC orders, $5 million of interest associated with customer refunds in
Minnesota for the 2013 electric rate case and the write off of $6.3 million of unamortized debt expense related to the junior
subordinated notes called in May 2013.
Interest charges increased $10.5 million, or 1.8 percent for 2012 compared with 2011. The increase is due to higher long-term debt
levels to fund investment in utility operations, partially offset by lower interest rates.