Xcel Energy 2013 Annual Report Download - page 68
Download and view the complete annual report
Please find page 68 of the 2013 Xcel Energy annual report below. You can navigate through the pages in the report by either clicking on the pages listed below, or by using the keyword search tool below to find specific information within the annual report.-
 1
1 -
2
-
3
-
4
-
5
-
6
-
7
-
8
-
9
-
10
-
11
-
12
-
13
-
14
-
15
-
16
-
17
-
18
-
19
-
20
-
21
-
22
-
23
-
24
-
25
-
26
-
27
-
28
-
29
-
30
-
31
-
32
-
33
-
34
-
35
-
36
-
37
-
38
-
39
-
40
-
41
-
42
-
43
-
44
-
45
-
46
-
47
-
48
-
49
-
50
-
51
-
52
-
53
-
54
-
55
-
56
-
57
-
 58
58 -
 59
59 -
 60
60 -
 61
61 -
 62
62 -
 63
63 -
 64
64 -
 65
65 -
 66
66 -
 67
67 -
 68
68 -
 69
69 -
 70
70 -
 71
71 -
 72
72 -
 73
73 -
 74
74 -
 75
75 -
 76
76 -
 77
77 -
 78
78 -
79
-
80
-
81
-
82
-
83
-
84
-
85
-
86
-
87
-
88
-
89
-
90
-
91
-
92
-
93
-
94
-
95
-
96
-
97
-
98
-
99
-
100
-
101
-
102
-
103
-
104
-
105
-
106
-
107
-
108
-
109
-
110
-
111
-
112
-
113
-
114
-
115
-
116
-
117
-
118
-
119
-
120
-
121
-
122
-
123
-
124
-
125
-
126
-
127
-
128
-
129
-
130
-
131
-
132
-
133
-
134
-
135
-
136
-
137
-
138
-
139
-
140
-
141
-
142
-
143
-
144
-
145
-
146
-
147
-
148
-
149
-
150
-
151
-
152
-
153
-
154
-
155
-
156
-
157
-
158
-
159
-
160
-
161
-
162
-
163
-
164
-
165
-
166
-
167
-
168
-
169
-
170
-
171
-
172
-
173
-
174
-
175
-
176
-
177
-
178
-
179
-
180
 |
 |

50
Results of Operations
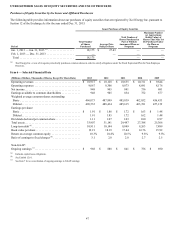
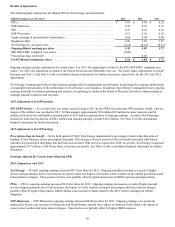
The following table summarizes the diluted EPS for Xcel Energy and subsidiaries:
Diluted Earnings (Loss) Per Share 2013 2012 2011
PSCo. . . . . . . . . . . . . . . . . . . . . . . . . . . . . . . . . . . . . . . . . . . . . . . . . . . . . . . . . . . . . . . . . . . $ 0.91 $ 0.90 $ 0.82
NSP-Minnesota . . . . . . . . . . . . . . . . . . . . . . . . . . . . . . . . . . . . . . . . . . . . . . . . . . . . . . . . . . 0.79 0.70 0.73
SPS . . . . . . . . . . . . . . . . . . . . . . . . . . . . . . . . . . . . . . . . . . . . . . . . . . . . . . . . . . . . . . . . . . . . 0.23 0.22 0.18
NSP-Wisconsin. . . . . . . . . . . . . . . . . . . . . . . . . . . . . . . . . . . . . . . . . . . . . . . . . . . . . . . . . . . 0.12 0.10 0.10
Equity earnings of unconsolidated subsidiaries . . . . . . . . . . . . . . . . . . . . . . . . . . . . . . . . . . 0.04 0.04 0.04
Regulated utility. . . . . . . . . . . . . . . . . . . . . . . . . . . . . . . . . . . . . . . . . . . . . . . . . . . . . . . . . . 2.09 1.96 1.87
Xcel Energy Inc. and other costs . . . . . . . . . . . . . . . . . . . . . . . . . . . . . . . . . . . . . . . . . . . . . (0.14)(0.14) (0.15)
Ongoing diluted earnings per share . . . . . . . . . . . . . . . . . . . . . . . . . . . . . . . . . . . . . . . . . 1.95 1.82 1.72
SPS 2004 FERC complaint case orders . . . . . . . . . . . . . . . . . . . . . . . . . . . . . . . . . . . . . . . . (0.04) — —
Prescription drug tax benefit . . . . . . . . . . . . . . . . . . . . . . . . . . . . . . . . . . . . . . . . . . . . . . . . — 0.03 —
GAAP diluted earnings per share. . . . . . . . . . . . . . . . . . . . . . . . . . . . . . . . . . . . . . . . . . . $ 1.91 $ 1.85 $ 1.72
Ongoing earnings exclude adjustments for certain items. For 2013, the adjustment is related to the SPS 2004 FERC complaint case
orders. For 2012, the adjustment is related to the Patient Protection and Affordable Care Act. See below under Adjustments to GAAP
Earnings and Note 12 and Note 6 to the consolidated financial statements for further discussion, respectively, for the 2013 and 2012
adjustments.
Xcel Energy’s management believes that ongoing earnings reflects management’s performance in operating the company and provides
a meaningful representation of the performance of Xcel Energy’s core business. In addition, Xcel Energy’s management uses ongoing
earnings internally for financial planning and analysis, for reporting of results to the Board of Directors and when communicating its
earnings outlook to analysts and investors.
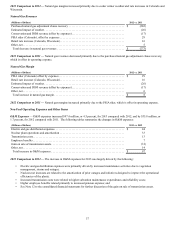
2013 Adjustment to GAAP Earnings
SPS FERC Orders — As a result of the two orders issued in August 2013 by the FERC for a potential SPS customer refund, a pre-tax
charge of $36 million was recorded in 2013. Of this amount, approximately $30 million ($26 million revenue reduction and $4
million of interest) was attributable to periods prior to 2013 and not representative of ongoing earnings. As such, GAAP earnings
include the total after tax amount of $24.4 million and ongoing earnings exclude $20.2 million. See Note 12 to the consolidated
financial statements for further discussion.
2012 Adjustment to GAAP Earnings
Prescription drug tax benefit — In the third quarter of 2012, Xcel Energy implemented a tax strategy related to the allocation of
funding of Xcel Energy’s retiree prescription drug plan. This strategy restored a portion of the tax benefit associated with federal
subsidies for prescription drug plans that had been accrued since 2004 and was expensed in 2010. As a result, Xcel Energy recognized
approximately $17 million, or $0.03 per share, of income tax benefit. See Note 6 to the consolidated financial statements for further
discussion.
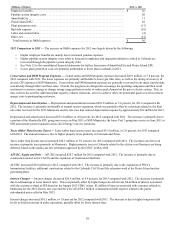
Earnings Adjusted for Certain Items (Ongoing EPS)
2013 Comparison with 2012
Xcel Energy — Overall, ongoing earnings increased $0.13 per share for 2013. Ongoing earnings increased as a result of higher
electric and gas margins due to rate increases in various states, the impact of favorable colder weather on the natural gas business and
reduced interest charges. These positive factors were partially offset by planned increases in O&M expenses and depreciation.
PSCo — PSCo’s ongoing earnings increased $0.01 per share for 2013. Ongoing earnings increased as a result of higher gas and
electric margins primarily due to rate increases, the impact of cooler weather on natural gas margins and lower interest charges,
partially offset by higher depreciation, O&M expenses and customer refunds related to the 2013 electric earnings test refund
obligation.
NSP-Minnesota — NSP-Minnesota’s ongoing earnings increased $0.09 per share for 2013. Ongoing earnings were positively
impacted by electric rate increases in Minnesota and South Dakota, interim rates subject to refund in North Dakota, the impact of
cooler winter weather and lower interest charges. These items were partially offset by higher O&M expenses.