Xcel Energy 2013 Annual Report Download - page 127
Download and view the complete annual report
Please find page 127 of the 2013 Xcel Energy annual report below. You can navigate through the pages in the report by either clicking on the pages listed below, or by using the keyword search tool below to find specific information within the annual report.-
 1
1 -
2
-
3
-
4
-
5
-
6
-
7
-
8
-
9
-
10
-
11
-
12
-
13
-
14
-
15
-
16
-
17
-
18
-
19
-
20
-
21
-
22
-
23
-
24
-
25
-
26
-
27
-
28
-
29
-
30
-
31
-
32
-
33
-
34
-
35
-
36
-
37
-
38
-
39
-
40
-
41
-
42
-
43
-
44
-
45
-
46
-
47
-
48
-
49
-
50
-
51
-
52
-
53
-
54
-
55
-
56
-
57
-
58
-
59
-
60
-
61
-
62
-
63
-
64
-
65
-
66
-
67
-
68
-
69
-
70
-
71
-
72
-
73
-
74
-
75
-
76
-
77
-
78
-
79
-
80
-
81
-
82
-
83
-
84
-
85
-
86
-
87
-
88
-
89
-
90
-
91
-
92
-
93
-
94
-
95
-
96
-
97
-
98
-
99
-
100
-
101
-
102
-
103
-
104
-
105
-
106
-
107
-
108
-
109
-
110
-
111
-
112
-
113
-
114
-
115
-
116
-
 117
117 -
 118
118 -
 119
119 -
 120
120 -
 121
121 -
 122
122 -
 123
123 -
 124
124 -
 125
125 -
 126
126 -
 127
127 -
 128
128 -
 129
129 -
 130
130 -
 131
131 -
 132
132 -
 133
133 -
 134
134 -
 135
135 -
 136
136 -
 137
137 -
138
-
139
-
140
-
141
-
142
-
143
-
144
-
145
-
146
-
147
-
148
-
149
-
150
-
151
-
152
-
153
-
154
-
155
-
156
-
157
-
158
-
159
-
160
-
161
-
162
-
163
-
164
-
165
-
166
-
167
-
168
-
169
-
170
-
171
-
172
-
173
-
174
-
175
-
176
-
177
-
178
-
179
-
180
 |
 |

109
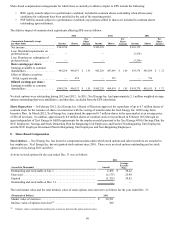
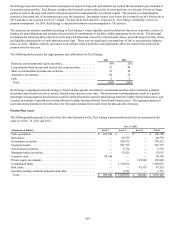
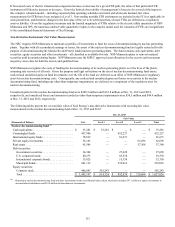
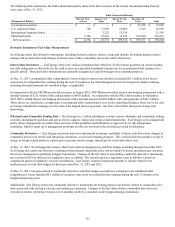
(Thousands of Dollars) Jan. 1, 2012 Net Realized
Gains (Losses) Net Unrealized
Gains (Losses)
Purchases,
Issuances and
Settlements, Net Transfers Out
of Level 3 Dec. 31, 2012
Asset-backed securities . . . . . . . . . . $ 7,867 $ (331) $ 1,481 $ (8,260) $ — $ 757
Mortgage-backed securities. . . . . . . 27,253 (724) 3,301 10,128 — 39,958
Private equity investments. . . . . . . . 479 — (65)(414) — —
Real estate . . . . . . . . . . . . . . . . . . . . 144 — 35 (179) — —
Total. . . . . . . . . . . . . . . . . . . . . . . . $ 35,743 $ (1,055) $ 4,752 $ 1,275 $ — $ 40,715
(Thousands of Dollars) Jan. 1, 2011 Net Realized
Gains (Losses) Net Unrealized
Gains (Losses)
Purchases,
Issuances and
Settlements, Net Transfers Out
of Level 3 Dec. 31, 2011
Asset-backed securities . . . . . . . . . . $ 2,585 $ (10) $ (664) $ 5,956 $ — $ 7,867
Mortgage-backed securities. . . . . . . 19,212 (1,669) 2,623 7,087 — 27,253
Private equity investments. . . . . . . . — 12 53 414 — 479
Real estate . . . . . . . . . . . . . . . . . . . . — (2)(34) 180 — 144
Total. . . . . . . . . . . . . . . . . . . . . . . . $ 21,797 $ (1,669) $ 1,978 $ 13,637 $ — $ 35,743
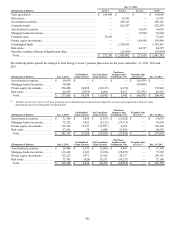
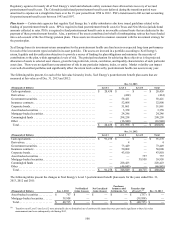
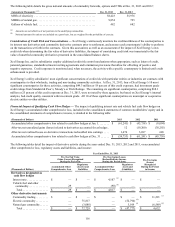
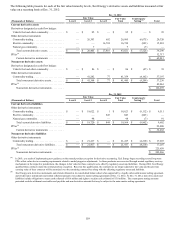
Benefit Obligations — A comparison of the actuarially computed benefit obligation and plan assets for Xcel Energy is presented in
the following table:
(Thousands of Dollars) 2013 2012
Change in Projected Benefit Obligation:
Obligation at Jan. 1 . . . . . . . . . . . . . . . . . . . . . . . . . . . . . . . . . . . . . . . . . . . . . . . . . . . . . . . . . . . . . . . $ 851,952 $ 776,847
Service cost . . . . . . . . . . . . . . . . . . . . . . . . . . . . . . . . . . . . . . . . . . . . . . . . . . . . . . . . . . . . . . . . . . . . . 4,079 4,203
Interest cost . . . . . . . . . . . . . . . . . . . . . . . . . . . . . . . . . . . . . . . . . . . . . . . . . . . . . . . . . . . . . . . . . . . . . 32,141 37,861
Medicare subsidy reimbursements . . . . . . . . . . . . . . . . . . . . . . . . . . . . . . . . . . . . . . . . . . . . . . . . . . . 1,197 3,741
Plan amendments. . . . . . . . . . . . . . . . . . . . . . . . . . . . . . . . . . . . . . . . . . . . . . . . . . . . . . . . . . . . . . . . . (14,571) (41,128)
Plan participants’ contributions. . . . . . . . . . . . . . . . . . . . . . . . . . . . . . . . . . . . . . . . . . . . . . . . . . . . . . 9,580 14,241
Actuarial (gain) loss . . . . . . . . . . . . . . . . . . . . . . . . . . . . . . . . . . . . . . . . . . . . . . . . . . . . . . . . . . . . . . (103,359) 119,949
Benefit payments. . . . . . . . . . . . . . . . . . . . . . . . . . . . . . . . . . . . . . . . . . . . . . . . . . . . . . . . . . . . . . . . . (49,591) (63,762)
Obligation at Dec. 31 . . . . . . . . . . . . . . . . . . . . . . . . . . . . . . . . . . . . . . . . . . . . . . . . . . . . . . . . . . . . $ 731,428 $ 851,952
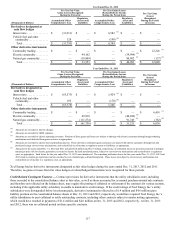
(Thousands of Dollars) 2013 2012
Change in Fair Value of Plan Assets:
Fair value of plan assets at Jan. 1 . . . . . . . . . . . . . . . . . . . . . . . . . . . . . . . . . . . . . . . . . . . . . . . . . . . . $ 480,842 $ 426,835
Actual return on plan assets. . . . . . . . . . . . . . . . . . . . . . . . . . . . . . . . . . . . . . . . . . . . . . . . . . . . . . . . . 33,644 56,385
Plan participants’ contributions. . . . . . . . . . . . . . . . . . . . . . . . . . . . . . . . . . . . . . . . . . . . . . . . . . . . . . 9,580 14,241
Employer contributions . . . . . . . . . . . . . . . . . . . . . . . . . . . . . . . . . . . . . . . . . . . . . . . . . . . . . . . . . . . . 17,561 47,143
Benefit payments. . . . . . . . . . . . . . . . . . . . . . . . . . . . . . . . . . . . . . . . . . . . . . . . . . . . . . . . . . . . . . . . . (49,591) (63,762)
Fair value of plan assets at Dec. 31. . . . . . . . . . . . . . . . . . . . . . . . . . . . . . . . . . . . . . . . . . . . . . . . . . $ 492,036 $ 480,842
(Thousands of Dollars) 2013 2012
Funded Status of Plans at Dec. 31:
Funded status. . . . . . . . . . . . . . . . . . . . . . . . . . . . . . . . . . . . . . . . . . . . . . . . . . . . . . . . . . . . . . . . . . . . $ (239,392) $ (371,110)
Current liabilities. . . . . . . . . . . . . . . . . . . . . . . . . . . . . . . . . . . . . . . . . . . . . . . . . . . . . . . . . . . . . . . . . (6,807) (6,070)
Noncurrent liabilities. . . . . . . . . . . . . . . . . . . . . . . . . . . . . . . . . . . . . . . . . . . . . . . . . . . . . . . . . . . . . . (232,585) (365,040)
Net postretirement amounts recognized on consolidated balance sheets . . . . . . . . . . . . . . . . . . . . . $ (239,392) $ (371,110)
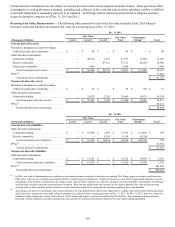
(Thousands of Dollars) 2013 2012
Amounts Not Yet Recognized as Components of Net Periodic Benefit Cost:
Net loss . . . . . . . . . . . . . . . . . . . . . . . . . . . . . . . . . . . . . . . . . . . . . . . . . . . . . . . . . . . . . . . . . . . . . . . . $ 195,630 $ 321,946
Prior service credit. . . . . . . . . . . . . . . . . . . . . . . . . . . . . . . . . . . . . . . . . . . . . . . . . . . . . . . . . . . . . . . . (86,298) (84,228)
Transition obligation . . . . . . . . . . . . . . . . . . . . . . . . . . . . . . . . . . . . . . . . . . . . . . . . . . . . . . . . . . . . . . 2 827
Total. . . . . . . . . . . . . . . . . . . . . . . . . . . . . . . . . . . . . . . . . . . . . . . . . . . . . . . . . . . . . . . . . . . . . . . . . . $ 109,334 $ 238,545