Xcel Energy 2013 Annual Report Download - page 75
Download and view the complete annual report
Please find page 75 of the 2013 Xcel Energy annual report below. You can navigate through the pages in the report by either clicking on the pages listed below, or by using the keyword search tool below to find specific information within the annual report.-
 1
1 -
2
-
3
-
4
-
5
-
6
-
7
-
8
-
9
-
10
-
11
-
12
-
13
-
14
-
15
-
16
-
17
-
18
-
19
-
20
-
21
-
22
-
23
-
24
-
25
-
26
-
27
-
28
-
29
-
30
-
31
-
32
-
33
-
34
-
35
-
36
-
37
-
38
-
39
-
40
-
41
-
42
-
43
-
44
-
45
-
46
-
47
-
48
-
49
-
50
-
51
-
52
-
53
-
54
-
55
-
56
-
57
-
58
-
59
-
60
-
61
-
62
-
63
-
64
-
 65
65 -
 66
66 -
 67
67 -
 68
68 -
 69
69 -
 70
70 -
 71
71 -
 72
72 -
 73
73 -
 74
74 -
 75
75 -
 76
76 -
 77
77 -
 78
78 -
 79
79 -
 80
80 -
 81
81 -
 82
82 -
 83
83 -
 84
84 -
 85
85 -
86
-
87
-
88
-
89
-
90
-
91
-
92
-
93
-
94
-
95
-
96
-
97
-
98
-
99
-
100
-
101
-
102
-
103
-
104
-
105
-
106
-
107
-
108
-
109
-
110
-
111
-
112
-
113
-
114
-
115
-
116
-
117
-
118
-
119
-
120
-
121
-
122
-
123
-
124
-
125
-
126
-
127
-
128
-
129
-
130
-
131
-
132
-
133
-
134
-
135
-
136
-
137
-
138
-
139
-
140
-
141
-
142
-
143
-
144
-
145
-
146
-
147
-
148
-
149
-
150
-
151
-
152
-
153
-
154
-
155
-
156
-
157
-
158
-
159
-
160
-
161
-
162
-
163
-
164
-
165
-
166
-
167
-
168
-
169
-
170
-
171
-
172
-
173
-
174
-
175
-
176
-
177
-
178
-
179
-
180
 |
 |

57
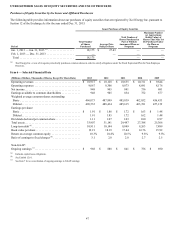
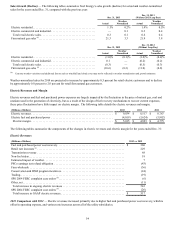
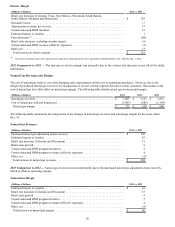
2013 Comparison to 2012 — Natural gas margins increased primarily due to cooler winter weather and rate increases in Colorado and
Wisconsin.
Natural Gas Revenues
(Millions of Dollars) 2012 vs. 2011
Purchased natural gas adjustment clause recovery . . . . . . . . . . . . . . . . . . . . . . . . . . . . . . . . . . . . . . . $ (282)
Estimated impact of weather . . . . . . . . . . . . . . . . . . . . . . . . . . . . . . . . . . . . . . . . . . . . . . . . . . . . . . . . (26)
Conservation and DSM revenue (offset by expenses). . . . . . . . . . . . . . . . . . . . . . . . . . . . . . . . . . . . . (17)
PSIA rider (Colorado), offset by expenses . . . . . . . . . . . . . . . . . . . . . . . . . . . . . . . . . . . . . . . . . . . . . 29
Retail rate increase (Colorado, Wisconsin). . . . . . . . . . . . . . . . . . . . . . . . . . . . . . . . . . . . . . . . . . . . . 16
Other, net. . . . . . . . . . . . . . . . . . . . . . . . . . . . . . . . . . . . . . . . . . . . . . . . . . . . . . . . . . . . . . . . . . . . . . . 5
Total decrease in natural gas revenues . . . . . . . . . . . . . . . . . . . . . . . . . . . . . . . . . . . . . . . . . . . . . . . $ (275)
2012 Comparison to 2011 — Natural gas revenues decreased primarily due to the purchased natural gas adjustment clause recovery,
which is offset in operating expense.
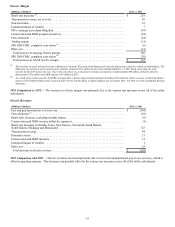
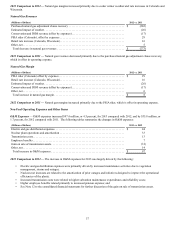
Natural Gas Margin
(Millions of Dollars) 2012 vs. 2011
PSIA rider (Colorado) offset by expenses. . . . . . . . . . . . . . . . . . . . . . . . . . . . . . . . . . . . . . . . . . . . . . $ 29
Retail rate increase (Colorado, Wisconsin). . . . . . . . . . . . . . . . . . . . . . . . . . . . . . . . . . . . . . . . . . . . . 16
Estimated impact of weather . . . . . . . . . . . . . . . . . . . . . . . . . . . . . . . . . . . . . . . . . . . . . . . . . . . . . . . . (26)
Conservation and DSM revenue (offset by expenses). . . . . . . . . . . . . . . . . . . . . . . . . . . . . . . . . . . . . (17)
Other, net. . . . . . . . . . . . . . . . . . . . . . . . . . . . . . . . . . . . . . . . . . . . . . . . . . . . . . . . . . . . . . . . . . . . . . . 6
Total increase in natural gas margin . . . . . . . . . . . . . . . . . . . . . . . . . . . . . . . . . . . . . . . . . . . . . . . . . $ 8
2012 Comparison to 2011 — Natural gas margins increased primarily due to the PSIA rider, which is offset in operating expense.
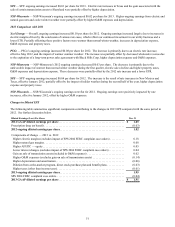
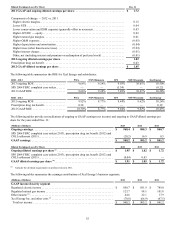
Non-Fuel Operating Expenses and Other Items
O&M Expenses — O&M expenses increased $97.4 million, or 4.5 percent, for 2013 compared with 2012, and by $35.8 million, or
1.7 percent, for 2012 compared with 2011. The following tables summarize the changes in O&M expenses:
(Millions of Dollars) 2013 vs. 2012
Electric and gas distribution expenses. . . . . . . . . . . . . . . . . . . . . . . . . . . . . . . . . . . . . . . . . . . . . . . . . $ 44
Nuclear plant operations and amortization . . . . . . . . . . . . . . . . . . . . . . . . . . . . . . . . . . . . . . . . . . . . . 33
Transmission costs. . . . . . . . . . . . . . . . . . . . . . . . . . . . . . . . . . . . . . . . . . . . . . . . . . . . . . . . . . . . . . . . 13
Employee benefits . . . . . . . . . . . . . . . . . . . . . . . . . . . . . . . . . . . . . . . . . . . . . . . . . . . . . . . . . . . . . . . . 7
Gain on sale of transmission assets . . . . . . . . . . . . . . . . . . . . . . . . . . . . . . . . . . . . . . . . . . . . . . . . . . . (14)
Other, net. . . . . . . . . . . . . . . . . . . . . . . . . . . . . . . . . . . . . . . . . . . . . . . . . . . . . . . . . . . . . . . . . . . . . . . 14
Total increase in O&M expenses . . . . . . . . . . . . . . . . . . . . . . . . . . . . . . . . . . . . . . . . . . . . . . . . . . . $ 97
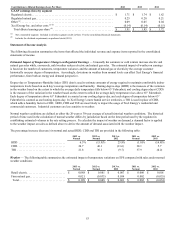
2013 Comparison to 2012 — The increase in O&M expenses for 2013 was largely driven by the following:
• Electric and gas distribution expenses were primarily driven by increased maintenance activities due to vegetation
management, storms and outages;
• Nuclear cost increases are related to the amortization of prior outages and initiatives designed to improve the operational
efficiencies of the plants;
• Increased transmission costs were related to higher substation maintenance expenditures and reliability costs;
• Higher employee benefits related primarily to increased pension expense; and
• See Note 12 to the consolidated financial statements for further discussion of the gain on sale of transmission assets.