Xcel Energy 2013 Annual Report Download - page 126
Download and view the complete annual report
Please find page 126 of the 2013 Xcel Energy annual report below. You can navigate through the pages in the report by either clicking on the pages listed below, or by using the keyword search tool below to find specific information within the annual report.-
 1
1 -
2
-
3
-
4
-
5
-
6
-
7
-
8
-
9
-
10
-
11
-
12
-
13
-
14
-
15
-
16
-
17
-
18
-
19
-
20
-
21
-
22
-
23
-
24
-
25
-
26
-
27
-
28
-
29
-
30
-
31
-
32
-
33
-
34
-
35
-
36
-
37
-
38
-
39
-
40
-
41
-
42
-
43
-
44
-
45
-
46
-
47
-
48
-
49
-
50
-
51
-
52
-
53
-
54
-
55
-
56
-
57
-
58
-
59
-
60
-
61
-
62
-
63
-
64
-
65
-
66
-
67
-
68
-
69
-
70
-
71
-
72
-
73
-
74
-
75
-
76
-
77
-
78
-
79
-
80
-
81
-
82
-
83
-
84
-
85
-
86
-
87
-
88
-
89
-
90
-
91
-
92
-
93
-
94
-
95
-
96
-
97
-
98
-
99
-
100
-
101
-
102
-
103
-
104
-
105
-
106
-
107
-
108
-
109
-
110
-
111
-
112
-
113
-
114
-
115
-
 116
116 -
 117
117 -
 118
118 -
 119
119 -
 120
120 -
 121
121 -
 122
122 -
 123
123 -
 124
124 -
 125
125 -
 126
126 -
 127
127 -
 128
128 -
 129
129 -
 130
130 -
 131
131 -
 132
132 -
 133
133 -
 134
134 -
 135
135 -
 136
136 -
137
-
138
-
139
-
140
-
141
-
142
-
143
-
144
-
145
-
146
-
147
-
148
-
149
-
150
-
151
-
152
-
153
-
154
-
155
-
156
-
157
-
158
-
159
-
160
-
161
-
162
-
163
-
164
-
165
-
166
-
167
-
168
-
169
-
170
-
171
-
172
-
173
-
174
-
175
-
176
-
177
-
178
-
179
-
180
 |
 |

108
Regulatory agencies for nearly all of Xcel Energy’s retail and wholesale utility customers have allowed rate recovery of accrued
postretirement benefit costs. The Colorado jurisdictional postretirement benefit costs deferred during the transition period were
amortized to expense on a straight-line basis over the 15-year period from 1998 to 2012. PSCo transitioned to full accrual accounting
for postretirement benefit costs between 1993 and 1997.
Plan Assets — Certain state agencies that regulate Xcel Energy Inc.’s utility subsidiaries also have issued guidelines related to the
funding of postretirement benefit costs. SPS is required to fund postretirement benefit costs for Texas and New Mexico jurisdictional
amounts collected in rates. PSCo is required to fund postretirement benefit costs in irrevocable external trusts that are dedicated to the
payment of these postretirement benefits. Also, a portion of the assets contributed on behalf of nonbargaining retirees has been funded
into a sub-account of the Xcel Energy pension plans. These assets are invested in a manner consistent with the investment strategy for
the pension plan.
Xcel Energy bases its investment-return assumption for the postretirement health care fund assets on expected long-term performance
for each of the investment types included in its asset portfolio. The assets are invested in a portfolio according to Xcel Energy’s
return, liquidity and diversification objectives to provide a source of funding for plan obligations and minimize the necessity of
contributions to the plan, within appropriate levels of risk. The principal mechanism for achieving these objectives is the projected
allocation of assets to selected asset classes, given the long-term risk, return, correlation, and liquidity characteristics of each particular
asset class. There were no significant concentrations of risk in any particular industry, index, or entity. Market volatility can impact
even well-diversified portfolios and significantly affect the return levels achieved by postretirement health care assets in any year.
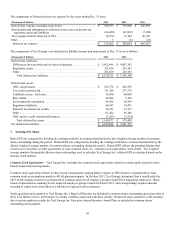
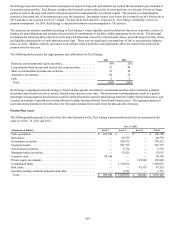
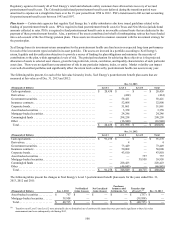
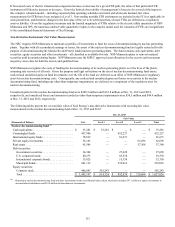
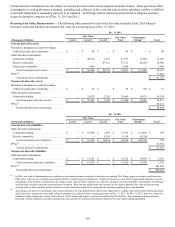
The following tables present, for each of the fair value hierarchy levels, Xcel Energy’s postretirement benefit plan assets that are
measured at fair value as of Dec. 31, 2013 and 2012:
Dec. 31, 2013
(Thousands of Dollars) Level 1 Level 2 Level 3 Total
Cash equivalents . . . . . . . . . . . . . . . . . . . . . . . . . . . . . . . . . . . . . . . . . . . . . $ 20,438 $ — $ — $ 20,438
Derivatives. . . . . . . . . . . . . . . . . . . . . . . . . . . . . . . . . . . . . . . . . . . . . . . . . . — (414) — (414)
Government securities. . . . . . . . . . . . . . . . . . . . . . . . . . . . . . . . . . . . . . . . . — 58,421 — 58,421
Insurance contracts . . . . . . . . . . . . . . . . . . . . . . . . . . . . . . . . . . . . . . . . . . . — 52,808 — 52,808
Corporate bonds. . . . . . . . . . . . . . . . . . . . . . . . . . . . . . . . . . . . . . . . . . . . . . — 51,861 — 51,861
Asset-backed securities . . . . . . . . . . . . . . . . . . . . . . . . . . . . . . . . . . . . . . . . — 3,358 — 3,358
Mortgage-backed securities. . . . . . . . . . . . . . . . . . . . . . . . . . . . . . . . . . . . . — 24,246 — 24,246
Commingled funds . . . . . . . . . . . . . . . . . . . . . . . . . . . . . . . . . . . . . . . . . . . — 298,258 — 298,258
Other . . . . . . . . . . . . . . . . . . . . . . . . . . . . . . . . . . . . . . . . . . . . . . . . . . . . . . — (16,940) — (16,940)
Total. . . . . . . . . . . . . . . . . . . . . . . . . . . . . . . . . . . . . . . . . . . . . . . . . . . . . . $ 20,438 $ 471,598 $ — $ 492,036
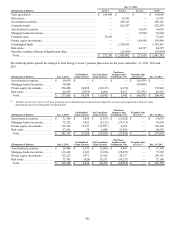
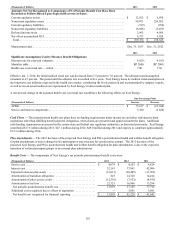
Dec. 31, 2012
(Thousands of Dollars) Level 1 Level 2 Level 3 Total
Cash equivalents . . . . . . . . . . . . . . . . . . . . . . . . . . . . . . . . . . . . . . . . . . . . . $ 91,278 $ — $ — $ 91,278
Derivatives. . . . . . . . . . . . . . . . . . . . . . . . . . . . . . . . . . . . . . . . . . . . . . . . . . — 4 — 4
Government securities. . . . . . . . . . . . . . . . . . . . . . . . . . . . . . . . . . . . . . . . . — 73,449 — 73,449
Insurance contracts . . . . . . . . . . . . . . . . . . . . . . . . . . . . . . . . . . . . . . . . . . . — 50,008 — 50,008
Corporate bonds. . . . . . . . . . . . . . . . . . . . . . . . . . . . . . . . . . . . . . . . . . . . . . — 43,810 — 43,810
Asset-backed securities . . . . . . . . . . . . . . . . . . . . . . . . . . . . . . . . . . . . . . . . — — 757 757
Mortgage-backed securities. . . . . . . . . . . . . . . . . . . . . . . . . . . . . . . . . . . . . — — 39,958 39,958
Commingled funds . . . . . . . . . . . . . . . . . . . . . . . . . . . . . . . . . . . . . . . . . . . — 228,423 — 228,423
Other . . . . . . . . . . . . . . . . . . . . . . . . . . . . . . . . . . . . . . . . . . . . . . . . . . . . . . — (46,845) — (46,845)
Total. . . . . . . . . . . . . . . . . . . . . . . . . . . . . . . . . . . . . . . . . . . . . . . . . . . . . . $ 91,278 $ 348,849 $ 40,715 $ 480,842
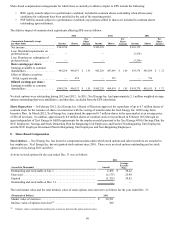
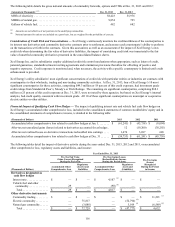
The following tables present the changes in Xcel Energy’s Level 3 postretirement benefit plan assets for the years ended Dec. 31,
2013, 2012 and 2011:
(Thousands of Dollars) Jan. 1, 2013 Net Realized
Gains (Losses) Net Unrealized
Gains (Losses)
Purchases,
Issuances and
Settlements, Net Transfers Out
of Level 3 (a) Dec. 31, 2013
Asset-backed securities . . . . . . . . . . $ 757 $ — $ — $ — $ (757) $ —
Mortgage-backed securities. . . . . . . 39,958 — — — (39,958) —
Total. . . . . . . . . . . . . . . . . . . . . . . . $ 40,715 $ — $ — $ — $ (40,715) $ —
(a) Transfers out of Level 3 into Level 2 were principally due to diminished use of unobservable inputs that were previously significant to these fair value
measurements and were subsequently sold during 2013.