Xcel Energy 2013 Annual Report Download - page 128
Download and view the complete annual report
Please find page 128 of the 2013 Xcel Energy annual report below. You can navigate through the pages in the report by either clicking on the pages listed below, or by using the keyword search tool below to find specific information within the annual report.-
 1
1 -
2
-
3
-
4
-
5
-
6
-
7
-
8
-
9
-
10
-
11
-
12
-
13
-
14
-
15
-
16
-
17
-
18
-
19
-
20
-
21
-
22
-
23
-
24
-
25
-
26
-
27
-
28
-
29
-
30
-
31
-
32
-
33
-
34
-
35
-
36
-
37
-
38
-
39
-
40
-
41
-
42
-
43
-
44
-
45
-
46
-
47
-
48
-
49
-
50
-
51
-
52
-
53
-
54
-
55
-
56
-
57
-
58
-
59
-
60
-
61
-
62
-
63
-
64
-
65
-
66
-
67
-
68
-
69
-
70
-
71
-
72
-
73
-
74
-
75
-
76
-
77
-
78
-
79
-
80
-
81
-
82
-
83
-
84
-
85
-
86
-
87
-
88
-
89
-
90
-
91
-
92
-
93
-
94
-
95
-
96
-
97
-
98
-
99
-
100
-
101
-
102
-
103
-
104
-
105
-
106
-
107
-
108
-
109
-
110
-
111
-
112
-
113
-
114
-
115
-
116
-
117
-
 118
118 -
 119
119 -
 120
120 -
 121
121 -
 122
122 -
 123
123 -
 124
124 -
 125
125 -
 126
126 -
 127
127 -
 128
128 -
 129
129 -
 130
130 -
 131
131 -
 132
132 -
 133
133 -
 134
134 -
 135
135 -
 136
136 -
 137
137 -
 138
138 -
139
-
140
-
141
-
142
-
143
-
144
-
145
-
146
-
147
-
148
-
149
-
150
-
151
-
152
-
153
-
154
-
155
-
156
-
157
-
158
-
159
-
160
-
161
-
162
-
163
-
164
-
165
-
166
-
167
-
168
-
169
-
170
-
171
-
172
-
173
-
174
-
175
-
176
-
177
-
178
-
179
-
180
 |
 |

110
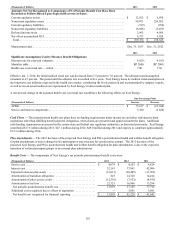
(Thousands of Dollars) 2013 2012
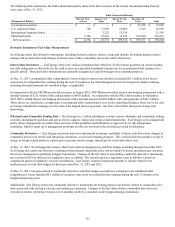
Amounts Not Yet Recognized as Components of Net Periodic Benefit Cost Have Been
Recorded as Follows Based Upon Expected Recovery in Rates:
Current regulatory assets. . . . . . . . . . . . . . . . . . . . . . . . . . . . . . . . . . . . . . . . . . . . . . . . . . . . . . . . . . . $ 12,102 $ 6,930
Noncurrent regulatory assets. . . . . . . . . . . . . . . . . . . . . . . . . . . . . . . . . . . . . . . . . . . . . . . . . . . . . . . . 99,071 226,052
Current regulatory liabilities . . . . . . . . . . . . . . . . . . . . . . . . . . . . . . . . . . . . . . . . . . . . . . . . . . . . . . . . (319) (954)
Noncurrent regulatory liabilities . . . . . . . . . . . . . . . . . . . . . . . . . . . . . . . . . . . . . . . . . . . . . . . . . . . . . (8,858) (3,453)
Deferred income taxes. . . . . . . . . . . . . . . . . . . . . . . . . . . . . . . . . . . . . . . . . . . . . . . . . . . . . . . . . . . . . 2,965 4,050
Net-of-tax accumulated OCI . . . . . . . . . . . . . . . . . . . . . . . . . . . . . . . . . . . . . . . . . . . . . . . . . . . . . . . . 4,373 5,920
Total. . . . . . . . . . . . . . . . . . . . . . . . . . . . . . . . . . . . . . . . . . . . . . . . . . . . . . . . . . . . . . . . . . . . . . . . . . $ 109,334 $ 238,545
Measurement date . . . . . . . . . . . . . . . . . . . . . . . . . . . . . . . . . . . . . . . . . . . . . . . . . . . . . . . . . . . . . . . . Dec. 31, 2013 Dec. 31, 2012
2013 2012
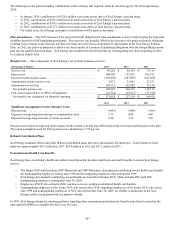
Significant Assumptions Used to Measure Benefit Obligations:
Discount rate for year-end valuation. . . . . . . . . . . . . . . . . . . . . . . . . . . . . . . . . . . . . . . . . . . . . . . . . . 4.82% 4.10%
Mortality table . . . . . . . . . . . . . . . . . . . . . . . . . . . . . . . . . . . . . . . . . . . . . . . . . . . . . . . . . . . . . . . . . . . RP 2000 RP 2000
Health care costs trend rate — initial . . . . . . . . . . . . . . . . . . . . . . . . . . . . . . . . . . . . . . . . . . . . . . . . . 7.00 7.50
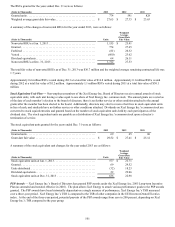
Effective Jan. 1, 2014, the initial medical trend rate was decreased from 7.5 percent to 7.0 percent. The ultimate trend assumption
remained at 4.5 percent. The period until the ultimate rate is reached is five years. Xcel Energy bases its medical trend assumption on
the long-term cost inflation expected in the health care market, considering the levels projected and recommended by industry experts,
as well as recent actual medical cost experienced by Xcel Energy’s retiree medical plan.
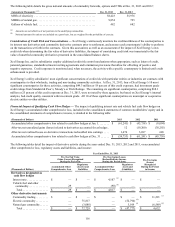
A one-percent change in the assumed health care cost trend rate would have the following effects on Xcel Energy:
One-Percentage Point
(Thousands of Dollars) Increase Decrease
APBO . . . . . . . . . . . . . . . . . . . . . . . . . . . . . . . . . . . . . . . . . . . . . . . . . . . . . . . . . . . . . . . . . . . . . . . . . $ 75,617 $ (63,360)
Service and interest components . . . . . . . . . . . . . . . . . . . . . . . . . . . . . . . . . . . . . . . . . . . . . . . . . . . . . 3,580 (2,826)
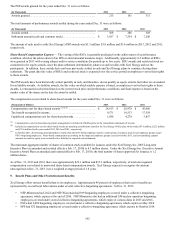
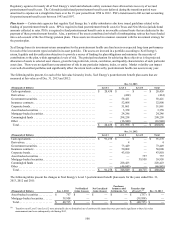
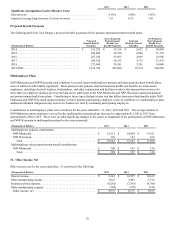
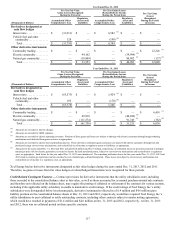
Cash Flows — The postretirement health care plans have no funding requirements under income tax and other retirement-related
regulations other than fulfilling benefit payment obligations, when claims are presented and approved under the plans. Additional
cash funding requirements are prescribed by certain state and federal rate regulatory authorities, as discussed previously. Xcel Energy
contributed $17.6 million during 2013, $47.1 million during 2012, $49.0 million during 2011 and expects to contribute approximately
$13.3 million during 2014.
Plan Amendments — The 2013 decrease of the projected Xcel Energy and PSCo postretirement health and welfare benefit obligation
for plan amendments is due to changes in the participant co-pay structure for certain retiree groups. The 2012 decrease of the
projected Xcel Energy and PSCo postretirement health and welfare benefit obligation for plan amendments is due to the expected
transition of certain participant groups to an external plan administrator.
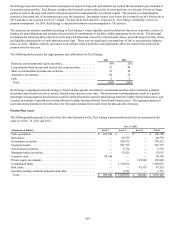
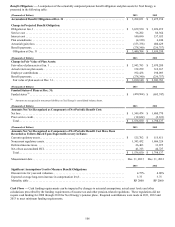
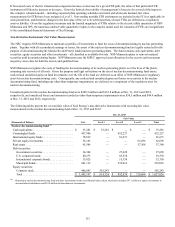
Benefit Costs — The components of Xcel Energy’s net periodic postretirement benefit costs were:
(Thousands of Dollars) 2013 2012 2011
Service cost . . . . . . . . . . . . . . . . . . . . . . . . . . . . . . . . . . . . . . . . . . . . . . . . . $ 4,079 $ 4,203 $ 4,824
Interest cost . . . . . . . . . . . . . . . . . . . . . . . . . . . . . . . . . . . . . . . . . . . . . . . . . 32,141 37,861 42,086
Expected return on plan assets . . . . . . . . . . . . . . . . . . . . . . . . . . . . . . . . . . (33,011)(28,409)(31,962)
Amortization of transition obligation . . . . . . . . . . . . . . . . . . . . . . . . . . . . . 825 14,320 14,444
Amortization of prior service credit . . . . . . . . . . . . . . . . . . . . . . . . . . . . . . (12,501)(7,552)(4,932)
Amortization of net loss . . . . . . . . . . . . . . . . . . . . . . . . . . . . . . . . . . . . . . . 22,325 16,906 13,294
Net periodic postretirement benefit cost. . . . . . . . . . . . . . . . . . . . . . . . . . 13,858 37,329 37,754
Additional cost recognized due to effects of regulation . . . . . . . . . . . . . . . — 3,891 3,891
Net benefit cost recognized for financial reporting. . . . . . . . . . . . . . . . . . $ 13,858 $ 41,220 $ 41,645