Xcel Energy 2013 Annual Report Download - page 176
Download and view the complete annual report
Please find page 176 of the 2013 Xcel Energy annual report below. You can navigate through the pages in the report by either clicking on the pages listed below, or by using the keyword search tool below to find specific information within the annual report.-
 1
1 -
2
-
3
-
4
-
5
-
6
-
7
-
8
-
9
-
10
-
11
-
12
-
13
-
14
-
15
-
16
-
17
-
18
-
19
-
20
-
21
-
22
-
23
-
24
-
25
-
26
-
27
-
28
-
29
-
30
-
31
-
32
-
33
-
34
-
35
-
36
-
37
-
38
-
39
-
40
-
41
-
42
-
43
-
44
-
45
-
46
-
47
-
48
-
49
-
50
-
51
-
52
-
53
-
54
-
55
-
56
-
57
-
58
-
59
-
60
-
61
-
62
-
63
-
64
-
65
-
66
-
67
-
68
-
69
-
70
-
71
-
72
-
73
-
74
-
75
-
76
-
77
-
78
-
79
-
80
-
81
-
82
-
83
-
84
-
85
-
86
-
87
-
88
-
89
-
90
-
91
-
92
-
93
-
94
-
95
-
96
-
97
-
98
-
99
-
100
-
101
-
102
-
103
-
104
-
105
-
106
-
107
-
108
-
109
-
110
-
111
-
112
-
113
-
114
-
115
-
116
-
117
-
118
-
119
-
120
-
121
-
122
-
123
-
124
-
125
-
126
-
127
-
128
-
129
-
130
-
131
-
132
-
133
-
134
-
135
-
136
-
137
-
138
-
139
-
140
-
141
-
142
-
143
-
144
-
145
-
146
-
147
-
148
-
149
-
150
-
151
-
152
-
153
-
154
-
155
-
156
-
157
-
158
-
159
-
160
-
161
-
162
-
163
-
164
-
165
-
 166
166 -
 167
167 -
 168
168 -
 169
169 -
 170
170 -
 171
171 -
 172
172 -
 173
173 -
 174
174 -
 175
175 -
 176
176 -
 177
177 -
 178
178 -
 179
179 -
 180
180
 |
 |

158
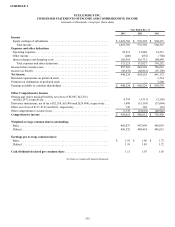
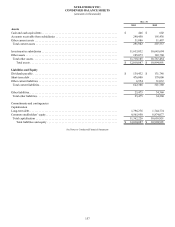
NOTES TO CONDENSED FINANCIAL STATEMENTS
Incorporated by reference are Xcel Energy’s consolidated statements of common stockholders’ equity and OCI in Part II, Item 8.
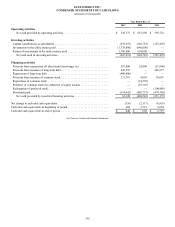
Basis of Presentation — The condensed financial information of Xcel Energy Inc. is presented to comply with Rule 12-04 of
Regulation S-X. Xcel Energy Inc.’s investments in subsidiaries are presented under the equity method of accounting. Under this
method, the assets and liabilities of subsidiaries are not consolidated. The investments in net assets of the subsidiaries are recorded in
the balance sheets. The income from operations of the subsidiaries is reported on a net basis as equity in income of subsidiaries.
As a holding company with no business operations, Xcel Energy Inc.’s assets consist primarily of investments in its utility
subsidiaries. Xcel Energy Inc.’s material cash inflows are only from dividends and other payments received from its utility
subsidiaries and the proceeds raised from the sale of debt and equity securities. The ability of its utility subsidiaries to make dividend
and other payments is subject to the availability of funds after taking into account their respective funding requirements, the terms of
their respective indebtedness, the regulations of the FERC under the Federal Power Act, and applicable state laws. Management does
not expect maintaining these requirements to have an impact on Xcel Energy Inc.’s ability to pay dividends at the current level in the
foreseeable future. Each of its utility subsidiaries, however, is legally distinct and has no obligation, contingent or otherwise, to make
funds available to Xcel Energy Inc.
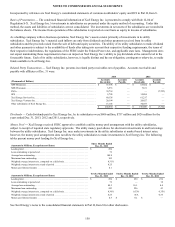
Related Party Transactions — Xcel Energy Inc. presents its related party receivables net of payables. Accounts receivable and
payable with affiliates at Dec. 31 were:
2013 2012
(Thousands of Dollars) Accounts
Receivable Accounts
Payable Accounts
Receivable Accounts
Payable
NSP-Minnesota. . . . . . . . . . . . . . . . . . . . . . . . . . . . . . . . . . . . . . . . . . . . . . . . . . . . . . . . . . . . . $ 57,596 $ — $ 63,682 $ —
NSP-Wisconsin. . . . . . . . . . . . . . . . . . . . . . . . . . . . . . . . . . . . . . . . . . . . . . . . . . . . . . . . . . . . . 6,933 — 7,631 —
PSCo . . . . . . . . . . . . . . . . . . . . . . . . . . . . . . . . . . . . . . . . . . . . . . . . . . . . . . . . . . . . . . . . . . . . . 74,739 — — (3,362)
SPS . . . . . . . . . . . . . . . . . . . . . . . . . . . . . . . . . . . . . . . . . . . . . . . . . . . . . . . . . . . . . . . . . . . . . . 5,705 — 15,806 —
Xcel Energy Services Inc.. . . . . . . . . . . . . . . . . . . . . . . . . . . . . . . . . . . . . . . . . . . . . . . . . . . . . 60,138 — 61,217 —
Xcel Energy Ventures Inc. . . . . . . . . . . . . . . . . . . . . . . . . . . . . . . . . . . . . . . . . . . . . . . . . . . . . 20,194 — 20,427 —
Other subsidiaries of Xcel Energy Inc.. . . . . . . . . . . . . . . . . . . . . . . . . . . . . . . . . . . . . . . . . . . 15,145 — 30,037 —
$ 240,450 $ — $ 198,800 $ (3,362)
Dividends — Cash dividends paid to Xcel Energy Inc. by its subsidiaries were $606 million, $757 million and $626 million for the
years ended Dec. 31, 2013, 2012 and 2011, respectively.
Money Pool — Xcel Energy received FERC approval to establish a utility money pool arrangement with the utility subsidiaries,
subject to receipt of required state regulatory approvals. The utility money pool allows for short-term investments in and borrowings
between the utility subsidiaries. Xcel Energy Inc. may make investments in the utility subsidiaries at market-based interest rates;
however, the money pool arrangement does not allow the utility subsidiaries to make investments in Xcel Energy Inc. The following
tables present money pool lending for Xcel Energy Inc.:
(Amounts in Millions, Except Interest Rates) Three Months Ended
Dec. 31, 2013
Lending limit. . . . . . . . . . . . . . . . . . . . . . . . . . . . . . . . . . . . . . . . . . . . . . . . . . . . . . . . $ 250
Loan outstanding at period end . . . . . . . . . . . . . . . . . . . . . . . . . . . . . . . . . . . . . . . . . . 72
Average loan outstanding . . . . . . . . . . . . . . . . . . . . . . . . . . . . . . . . . . . . . . . . . . . . . . 109.8
Maximum loan outstanding. . . . . . . . . . . . . . . . . . . . . . . . . . . . . . . . . . . . . . . . . . . . . 182
Weighted average interest rate, computed on a daily basis. . . . . . . . . . . . . . . . . . . . . 0.31%
Weighted average interest rate at end of period . . . . . . . . . . . . . . . . . . . . . . . . . . . . . 0.25
Money pool interest income . . . . . . . . . . . . . . . . . . . . . . . . . . . . . . . . . . . . . . . . . . . . $ 0.1
(Amounts in Millions, Except Interest Rates) Twelve Months Ended
Dec. 31, 2013 Twelve Months Ended
Dec. 31, 2012 Twelve Months Ended
Dec. 31, 2011
Lending limit. . . . . . . . . . . . . . . . . . . . . . . . . . . . . . . . . . . . . . . . . . . . . . . . . . . . . . . . $ 250 $ 250 $ 250
Loan outstanding at period end . . . . . . . . . . . . . . . . . . . . . . . . . . . . . . . . . . . . . . . . . . 72 — 18
Average loan outstanding . . . . . . . . . . . . . . . . . . . . . . . . . . . . . . . . . . . . . . . . . . . . . . 88.2 26.1 0.4
Maximum loan outstanding. . . . . . . . . . . . . . . . . . . . . . . . . . . . . . . . . . . . . . . . . . . . . 243 226 43
Weighted average interest rate, computed on a daily basis. . . . . . . . . . . . . . . . . . . . . 0.30% 0.33% 0.35%
Weighted average interest rate at end of period . . . . . . . . . . . . . . . . . . . . . . . . . . . . . 0.25 N/A 0.35
Money pool interest income . . . . . . . . . . . . . . . . . . . . . . . . . . . . . . . . . . . . . . . . . . . . $ 0.3 $ 0.1 $ —
See Xcel Energy’s notes to the consolidated financial statements in Part II, Item 8 for other disclosures.