Xcel Energy 2013 Annual Report Download - page 49
Download and view the complete annual report
Please find page 49 of the 2013 Xcel Energy annual report below. You can navigate through the pages in the report by either clicking on the pages listed below, or by using the keyword search tool below to find specific information within the annual report.-
 1
1 -
2
-
3
-
4
-
5
-
6
-
7
-
8
-
9
-
10
-
11
-
12
-
13
-
14
-
15
-
16
-
17
-
18
-
19
-
20
-
21
-
22
-
23
-
24
-
25
-
26
-
27
-
28
-
29
-
30
-
31
-
32
-
33
-
34
-
35
-
36
-
37
-
38
-
 39
39 -
 40
40 -
 41
41 -
 42
42 -
 43
43 -
 44
44 -
 45
45 -
 46
46 -
 47
47 -
 48
48 -
 49
49 -
 50
50 -
 51
51 -
 52
52 -
 53
53 -
 54
54 -
 55
55 -
 56
56 -
 57
57 -
 58
58 -
 59
59 -
60
-
61
-
62
-
63
-
64
-
65
-
66
-
67
-
68
-
69
-
70
-
71
-
72
-
73
-
74
-
75
-
76
-
77
-
78
-
79
-
80
-
81
-
82
-
83
-
84
-
85
-
86
-
87
-
88
-
89
-
90
-
91
-
92
-
93
-
94
-
95
-
96
-
97
-
98
-
99
-
100
-
101
-
102
-
103
-
104
-
105
-
106
-
107
-
108
-
109
-
110
-
111
-
112
-
113
-
114
-
115
-
116
-
117
-
118
-
119
-
120
-
121
-
122
-
123
-
124
-
125
-
126
-
127
-
128
-
129
-
130
-
131
-
132
-
133
-
134
-
135
-
136
-
137
-
138
-
139
-
140
-
141
-
142
-
143
-
144
-
145
-
146
-
147
-
148
-
149
-
150
-
151
-
152
-
153
-
154
-
155
-
156
-
157
-
158
-
159
-
160
-
161
-
162
-
163
-
164
-
165
-
166
-
167
-
168
-
169
-
170
-
171
-
172
-
173
-
174
-
175
-
176
-
177
-
178
-
179
-
180
 |
 |

31
PSCo has natural gas supply, transportation and storage agreements that include obligations for the purchase and/or delivery of
specified volumes of natural gas or to make payments in lieu of delivery. At Dec. 31, 2013, PSCo was committed to approximately
$2.0 billion in such obligations under these contracts, which expire in various years from 2014 through 2029.
PSCo purchases natural gas by optimizing a balance of long-term and short-term natural gas purchases, firm transportation and natural
gas storage contracts. During 2013, PSCo purchased natural gas from approximately 40 suppliers.
See Items 1A and 7 for further discussion of natural gas supply and costs.
SPS
Natural Gas Facilities Used for Electric Generation
SPS does not provide retail natural gas service, but purchases and transports natural gas for certain of its generation facilities and
operates natural gas pipeline facilities connecting the generation facilities to interstate natural gas pipelines. SPS is subject to the
jurisdiction of the FERC with respect to certain natural gas transactions in interstate commerce; and to the jurisdiction of the DOT and
the PUCT for pipeline safety compliance.
See Items 1A and 7 for further discussion of natural gas supply and costs.
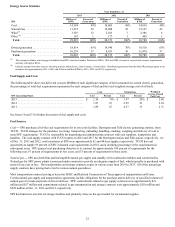
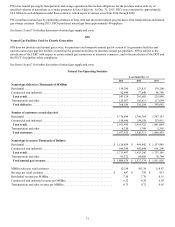
Natural Gas Operating Statistics
Year Ended Dec. 31
2013 2012 2011
Natural gas deliveries (Thousands of MMBtu)
Residential . . . . . . . . . . . . . . . . . . . . . . . . . . . . . . . . . . . . . . . . . . . . . . . . . . . . . . . . . . . . . 150,280 123,835 139,200
Commercial and industrial . . . . . . . . . . . . . . . . . . . . . . . . . . . . . . . . . . . . . . . . . . . . . . . . . 92,849 77,848 86,788
Total retail. . . . . . . . . . . . . . . . . . . . . . . . . . . . . . . . . . . . . . . . . . . . . . . . . . . . . . . . . . . . 243,129 201,683 225,988
Transportation and other. . . . . . . . . . . . . . . . . . . . . . . . . . . . . . . . . . . . . . . . . . . . . . . . . . . 125,057 116,611 117,654
Total deliveries . . . . . . . . . . . . . . . . . . . . . . . . . . . . . . . . . . . . . . . . . . . . . . . . . . . . . . . . 368,186 318,294 343,642
Number of customers at end of period
Residential . . . . . . . . . . . . . . . . . . . . . . . . . . . . . . . . . . . . . . . . . . . . . . . . . . . . . . . . . . . . . 1,776,849 1,760,364 1,747,153
Commercial and industrial . . . . . . . . . . . . . . . . . . . . . . . . . . . . . . . . . . . . . . . . . . . . . . . . . 154,646 154,158 153,911
Total retail. . . . . . . . . . . . . . . . . . . . . . . . . . . . . . . . . . . . . . . . . . . . . . . . . . . . . . . . . . . . 1,931,495 1,914,522 1,901,064
Transportation and other. . . . . . . . . . . . . . . . . . . . . . . . . . . . . . . . . . . . . . . . . . . . . . . . . . . 6,320 5,789 5,395
Total customers. . . . . . . . . . . . . . . . . . . . . . . . . . . . . . . . . . . . . . . . . . . . . . . . . . . . . . . . 1,937,815 1,920,311 1,906,459
Natural gas revenues (Thousands of Dollars)
Residential . . . . . . . . . . . . . . . . . . . . . . . . . . . . . . . . . . . . . . . . . . . . . . . . . . . . . . . . . . . . . $ 1,126,859 $ 964,642 $ 1,133,888
Commercial and industrial . . . . . . . . . . . . . . . . . . . . . . . . . . . . . . . . . . . . . . . . . . . . . . . . . 586,548 488,644 601,298
Total retail. . . . . . . . . . . . . . . . . . . . . . . . . . . . . . . . . . . . . . . . . . . . . . . . . . . . . . . . . . . . 1,713,407 1,453,286 1,735,186
Transportation and other. . . . . . . . . . . . . . . . . . . . . . . . . . . . . . . . . . . . . . . . . . . . . . . . . . . 91,272 84,088 76,740
Total natural gas revenues. . . . . . . . . . . . . . . . . . . . . . . . . . . . . . . . . . . . . . . . . . . . . . . $ 1,804,679 $ 1,537,374 $ 1,811,926
MMBtu sales per retail customer . . . . . . . . . . . . . . . . . . . . . . . . . . . . . . . . . . . . . . . . . . . . 125.88 105.34 118.87
Revenue per retail customer . . . . . . . . . . . . . . . . . . . . . . . . . . . . . . . . . . . . . . . . . . . . . . . . $ 887 $ 759 $ 913
Residential revenue per MMBtu. . . . . . . . . . . . . . . . . . . . . . . . . . . . . . . . . . . . . . . . . . . . . 7.50 7.79 8.15
Commercial and industrial revenue per MMBtu . . . . . . . . . . . . . . . . . . . . . . . . . . . . . . . . 6.32 6.28 6.93
Transportation and other revenue per MMBtu. . . . . . . . . . . . . . . . . . . . . . . . . . . . . . . . . . 0.73 0.72 0.65