Xcel Energy 2013 Annual Report Download - page 71
Download and view the complete annual report
Please find page 71 of the 2013 Xcel Energy annual report below. You can navigate through the pages in the report by either clicking on the pages listed below, or by using the keyword search tool below to find specific information within the annual report.-
 1
1 -
2
-
3
-
4
-
5
-
6
-
7
-
8
-
9
-
10
-
11
-
12
-
13
-
14
-
15
-
16
-
17
-
18
-
19
-
20
-
21
-
22
-
23
-
24
-
25
-
26
-
27
-
28
-
29
-
30
-
31
-
32
-
33
-
34
-
35
-
36
-
37
-
38
-
39
-
40
-
41
-
42
-
43
-
44
-
45
-
46
-
47
-
48
-
49
-
50
-
51
-
52
-
53
-
54
-
55
-
56
-
57
-
58
-
59
-
60
-
 61
61 -
 62
62 -
 63
63 -
 64
64 -
 65
65 -
 66
66 -
 67
67 -
 68
68 -
 69
69 -
 70
70 -
 71
71 -
 72
72 -
 73
73 -
 74
74 -
 75
75 -
 76
76 -
 77
77 -
 78
78 -
 79
79 -
 80
80 -
 81
81 -
82
-
83
-
84
-
85
-
86
-
87
-
88
-
89
-
90
-
91
-
92
-
93
-
94
-
95
-
96
-
97
-
98
-
99
-
100
-
101
-
102
-
103
-
104
-
105
-
106
-
107
-
108
-
109
-
110
-
111
-
112
-
113
-
114
-
115
-
116
-
117
-
118
-
119
-
120
-
121
-
122
-
123
-
124
-
125
-
126
-
127
-
128
-
129
-
130
-
131
-
132
-
133
-
134
-
135
-
136
-
137
-
138
-
139
-
140
-
141
-
142
-
143
-
144
-
145
-
146
-
147
-
148
-
149
-
150
-
151
-
152
-
153
-
154
-
155
-
156
-
157
-
158
-
159
-
160
-
161
-
162
-
163
-
164
-
165
-
166
-
167
-
168
-
169
-
170
-
171
-
172
-
173
-
174
-
175
-
176
-
177
-
178
-
179
-
180
 |
 |

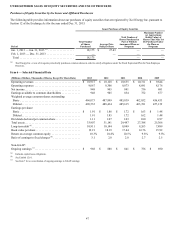
53
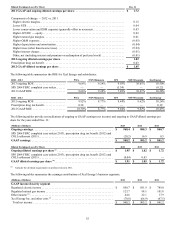
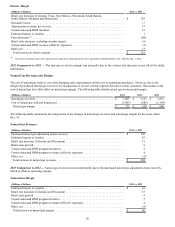
Contributions to Diluted Earnings (Loss) Per Share 2013 2012 2011
GAAP earnings (loss) by segment
Regulated electric. . . . . . . . . . . . . . . . . . . . . . . . . . . . . . . . . . . . . . . . . . . . . . . . . . . . . . . . . $ 1.71 $ 1.74 $ 1.62
Regulated natural gas. . . . . . . . . . . . . . . . . . . . . . . . . . . . . . . . . . . . . . . . . . . . . . . . . . . . . . 0.25 0.20 0.21
Other (a). . . . . . . . . . . . . . . . . . . . . . . . . . . . . . . . . . . . . . . . . . . . . . . . . . . . . . . . . . . . . . . . . 0.09 0.05 0.04
Xcel Energy Inc. and other costs (a) (b) . . . . . . . . . . . . . . . . . . . . . . . . . . . . . . . . . . . . . . . . . (0.14)(0.14) (0.15)
Total diluted earnings per share (b) . . . . . . . . . . . . . . . . . . . . . . . . . . . . . . . . . . . . . . . . . . $ 1.91 $ 1.85 $ 1.72
(a) Not a reportable segment. Included in all other segment results in Note 17 to the consolidated financial statements.
(b) Includes the dividend requirements on preferred stock (2011).
Statement of Income Analysis
The following discussion summarizes the items that affected the individual revenue and expense items reported in the consolidated
statements of income.
Estimated Impact of Temperature Changes on Regulated Earnings — Unusually hot summers or cold winters increase electric and
natural gas sales while, conversely, mild weather reduces electric and natural gas sales. The estimated impact of weather on earnings
is based on the number of customers, temperature variances and the amount of natural gas or electricity the average customer
historically uses per degree of temperature. Accordingly, deviations in weather from normal levels can affect Xcel Energy’s financial
performance, from both an energy and demand perspective.
Degree-day or Temperature-Humidity Index (THI) data is used to estimate amounts of energy required to maintain comfortable indoor
temperature levels based on each day’s average temperature and humidity. Heating degree-days (HDD) is the measure of the variation
in the weather based on the extent to which the average daily temperature falls below 65° Fahrenheit, and cooling degree-days (CDD)
is the measure of the variation in the weather based on the extent to which the average daily temperature rises above 65° Fahrenheit.
Each degree of temperature above 65° Fahrenheit is counted as one cooling degree-day, and each degree of temperature below 65°
Fahrenheit is counted as one heating degree-day. In Xcel Energy’s more humid service territories, a THI is used in place of CDD,
which adds a humidity factor to CDD. HDD, CDD and THI are most likely to impact the usage of Xcel Energy’s residential and
commercial customers. Industrial customers are less sensitive to weather.
Normal weather conditions are defined as either the 20-year or 30-year average of actual historical weather conditions. The historical
period of time used in the calculation of normal weather differs by jurisdiction based on the time period used by the regulator in
establishing estimated volumes in the rate setting process. To calculate the impact of weather on demand, a demand factor is applied
to the weather impact on sales as defined above to derive the amount of demand associated with the weather impact.
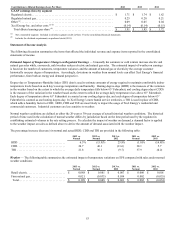
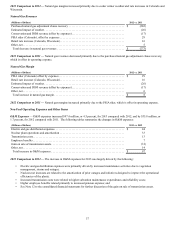
The percentage increase (decrease) in normal and actual HDD, CDD and THI are provided in the following table:
2013 vs.
Normal 2012 vs.
Normal 2013 vs.
2012 2011 vs.
Normal 2012 vs.
2011
HDD . . . . . . . . . . . . . . . . . . . . . . . . . . . . . . . . . 6.5% (15.9)% 25.8% (1.0)% (14.8)%
CDD. . . . . . . . . . . . . . . . . . . . . . . . . . . . . . . . . . 24.7 46.1 (13.6) 38.1 5.7
THI . . . . . . . . . . . . . . . . . . . . . . . . . . . . . . . . . . 21.8 36.1 (9.7) 37.9 (0.2)
Weather — The following table summarizes the estimated impact of temperature variations on EPS compared with sales under normal
weather conditions:
2013 vs.
Normal 2012 vs.
Normal 2013 vs.
2012 2011 vs.
Normal 2012 vs.
2011
Retail electric. . . . . . . . . . . . . . . . . . . . . . . . . . . $ 0.088 $ 0.081 $ 0.007 $ 0.080 $ 0.001
Firm natural gas. . . . . . . . . . . . . . . . . . . . . . . . . 0.021 (0.033) 0.054 0.002 (0.035)
Total. . . . . . . . . . . . . . . . . . . . . . . . . . . . . . . . . $ 0.109 $ 0.048 $ 0.061 $ 0.082 $ (0.034)