Xcel Energy 2013 Annual Report Download - page 130
Download and view the complete annual report
Please find page 130 of the 2013 Xcel Energy annual report below. You can navigate through the pages in the report by either clicking on the pages listed below, or by using the keyword search tool below to find specific information within the annual report.-
 1
1 -
2
-
3
-
4
-
5
-
6
-
7
-
8
-
9
-
10
-
11
-
12
-
13
-
14
-
15
-
16
-
17
-
18
-
19
-
20
-
21
-
22
-
23
-
24
-
25
-
26
-
27
-
28
-
29
-
30
-
31
-
32
-
33
-
34
-
35
-
36
-
37
-
38
-
39
-
40
-
41
-
42
-
43
-
44
-
45
-
46
-
47
-
48
-
49
-
50
-
51
-
52
-
53
-
54
-
55
-
56
-
57
-
58
-
59
-
60
-
61
-
62
-
63
-
64
-
65
-
66
-
67
-
68
-
69
-
70
-
71
-
72
-
73
-
74
-
75
-
76
-
77
-
78
-
79
-
80
-
81
-
82
-
83
-
84
-
85
-
86
-
87
-
88
-
89
-
90
-
91
-
92
-
93
-
94
-
95
-
96
-
97
-
98
-
99
-
100
-
101
-
102
-
103
-
104
-
105
-
106
-
107
-
108
-
109
-
110
-
111
-
112
-
113
-
114
-
115
-
116
-
117
-
118
-
119
-
 120
120 -
 121
121 -
 122
122 -
 123
123 -
 124
124 -
 125
125 -
 126
126 -
 127
127 -
 128
128 -
 129
129 -
 130
130 -
 131
131 -
 132
132 -
 133
133 -
 134
134 -
 135
135 -
 136
136 -
 137
137 -
 138
138 -
 139
139 -
 140
140 -
141
-
142
-
143
-
144
-
145
-
146
-
147
-
148
-
149
-
150
-
151
-
152
-
153
-
154
-
155
-
156
-
157
-
158
-
159
-
160
-
161
-
162
-
163
-
164
-
165
-
166
-
167
-
168
-
169
-
170
-
171
-
172
-
173
-
174
-
175
-
176
-
177
-
178
-
179
-
180
 |
 |
112
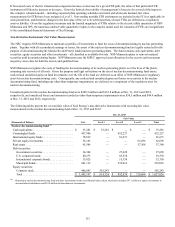
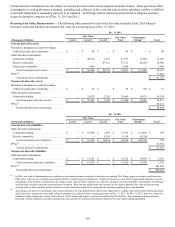
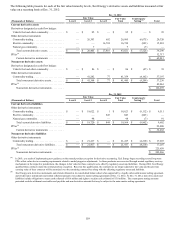
11. Fair Value of Financial Assets and Liabilities
Fair Value Measurements
The accounting guidance for fair value measurements and disclosures provides a single definition of fair value and requires certain
disclosures about assets and liabilities measured at fair value. A hierarchical framework for disclosing the observability of the inputs
utilized in measuring assets and liabilities at fair value is established by this guidance. The three levels in the hierarchy are as follows:
Level 1 — Quoted prices are available in active markets for identical assets or liabilities as of the reporting date. The types
of assets and liabilities included in Level 1 are highly liquid and actively traded instruments with quoted prices.
Level 2 — Pricing inputs are other than quoted prices in active markets, but are either directly or indirectly observable as of
the reporting date. The types of assets and liabilities included in Level 2 are typically either comparable to actively traded
securities or contracts, or priced with models using highly observable inputs.
Level 3 — Significant inputs to pricing have little or no observability as of the reporting date. The types of assets and
liabilities included in Level 3 are those valued with models requiring significant management judgment or estimation.
Specific valuation methods include the following:
Cash equivalents — The fair values of cash equivalents are generally based on cost plus accrued interest; money market funds are
measured using quoted net asset values.
Investments in equity securities and other funds — Equity securities are valued using quoted prices in active markets. The fair values
for commingled funds, international equity funds, private equity investments and real estate investments are measured using net asset
values, which take into consideration the value of underlying fund investments, as well as the other accrued assets and liabilities of a
fund, in order to determine a per-share market value. The investments in commingled funds and international equity funds may be
redeemed for net asset value with proper notice. Proper notice varies by fund and can range from daily with one or two days notice to
annually with 90 days notice. Private equity investments require approval of the fund for any unscheduled redemption, and such
redemptions may be approved or denied by the fund at its sole discretion. Unscheduled distributions from real estate investments may
be redeemed with proper notice, which is typically quarterly with 45-90 days notice; however, withdrawals from real estate
investments may be delayed or discounted as a result of fund illiquidity. Based on Xcel Energy’s evaluation of its ability to redeem
private equity and real estate investments, fair value measurements for private equity and real estate investments have been assigned a
Level 3.
Investments in debt securities — Fair values for debt securities are determined by a third party pricing service using recent trades and
observable spreads from benchmark interest rates for similar securities.
Interest rate derivatives — The fair values of interest rate derivatives are based on broker quotes that utilize current market interest
rate forecasts.
Commodity derivatives — The methods used to measure the fair value of commodity derivative forwards and options utilize forward
prices and volatilities, as well as pricing adjustments for specific delivery locations, and are generally assigned a Level 2. When
contractual settlements extend to periods beyond those readily observable on active exchanges or quoted by brokers, the significance
of the use of less observable forecasts of long-term forward prices and volatilities on a valuation is evaluated, and may result in Level
3 classification.
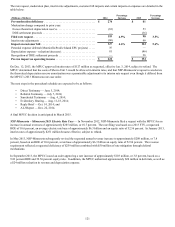
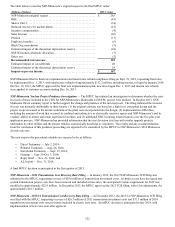
Electric commodity derivatives held by NSP-Minnesota include transmission congestion instruments purchased from MISO, PJM,
ERCOT and NYISO, generally referred to as FTRs. Electric commodity derivatives held by SPS include FTRs purchased from SPP.
FTRs purchased from an RTO are financial instruments that entitle or obligate the holder to monthly revenues or charges based on
transmission congestion across a given transmission path. The value of an FTR is derived from, and designed to offset, the cost of
energy congestion, which is caused by overall transmission load and other transmission constraints. In addition to overall
transmission load, congestion is also influenced by the operating schedules of power plants and the consumption of electricity
pertinent to a given transmission path. Unplanned plant outages, scheduled plant maintenance, changes in the relative costs of fuels
used in generation, weather and overall changes in demand for electricity can each impact the operating schedules of the power plants
on the transmission grid and the value of an FTR. The valuation process for FTRs utilizes complex iterative modeling to predict the
impacts of forecasted changes in these drivers of transmission system congestion on the historical pricing of FTR purchases.