Xcel Energy 2013 Annual Report Download - page 74
Download and view the complete annual report
Please find page 74 of the 2013 Xcel Energy annual report below. You can navigate through the pages in the report by either clicking on the pages listed below, or by using the keyword search tool below to find specific information within the annual report.-
 1
1 -
2
-
3
-
4
-
5
-
6
-
7
-
8
-
9
-
10
-
11
-
12
-
13
-
14
-
15
-
16
-
17
-
18
-
19
-
20
-
21
-
22
-
23
-
24
-
25
-
26
-
27
-
28
-
29
-
30
-
31
-
32
-
33
-
34
-
35
-
36
-
37
-
38
-
39
-
40
-
41
-
42
-
43
-
44
-
45
-
46
-
47
-
48
-
49
-
50
-
51
-
52
-
53
-
54
-
55
-
56
-
57
-
58
-
59
-
60
-
61
-
62
-
63
-
 64
64 -
 65
65 -
 66
66 -
 67
67 -
 68
68 -
 69
69 -
 70
70 -
 71
71 -
 72
72 -
 73
73 -
 74
74 -
 75
75 -
 76
76 -
 77
77 -
 78
78 -
 79
79 -
 80
80 -
 81
81 -
 82
82 -
 83
83 -
 84
84 -
85
-
86
-
87
-
88
-
89
-
90
-
91
-
92
-
93
-
94
-
95
-
96
-
97
-
98
-
99
-
100
-
101
-
102
-
103
-
104
-
105
-
106
-
107
-
108
-
109
-
110
-
111
-
112
-
113
-
114
-
115
-
116
-
117
-
118
-
119
-
120
-
121
-
122
-
123
-
124
-
125
-
126
-
127
-
128
-
129
-
130
-
131
-
132
-
133
-
134
-
135
-
136
-
137
-
138
-
139
-
140
-
141
-
142
-
143
-
144
-
145
-
146
-
147
-
148
-
149
-
150
-
151
-
152
-
153
-
154
-
155
-
156
-
157
-
158
-
159
-
160
-
161
-
162
-
163
-
164
-
165
-
166
-
167
-
168
-
169
-
170
-
171
-
172
-
173
-
174
-
175
-
176
-
177
-
178
-
179
-
180
 |
 |

56
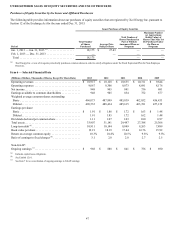
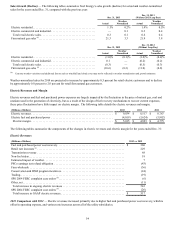
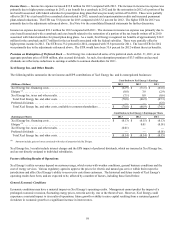
Electric Margin
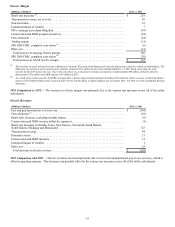
(Millions of Dollars) 2012 vs. 2011
Retail rate increases (Colorado, Texas, New Mexico, Wisconsin, South Dakota,
North Dakota, Michigan and Minnesota) . . . . . . . . . . . . . . . . . . . . . . . . . . . . . . . . . . . . . . . . . . . . . . $ 125
Demand revenue . . . . . . . . . . . . . . . . . . . . . . . . . . . . . . . . . . . . . . . . . . . . . . . . . . . . . . . . . . . . . . . . . 13
Transmission revenue, net of costs . . . . . . . . . . . . . . . . . . . . . . . . . . . . . . . . . . . . . . . . . . . . . . . . . . . 13
Conservation and DSM incentive . . . . . . . . . . . . . . . . . . . . . . . . . . . . . . . . . . . . . . . . . . . . . . . . . . . . 12
Estimated impact of weather . . . . . . . . . . . . . . . . . . . . . . . . . . . . . . . . . . . . . . . . . . . . . . . . . . . . . . . . 1
Firm wholesale (a) . . . . . . . . . . . . . . . . . . . . . . . . . . . . . . . . . . . . . . . . . . . . . . . . . . . . . . . . . . . . . . . . (48)
Retail sales decrease, excluding weather impact. . . . . . . . . . . . . . . . . . . . . . . . . . . . . . . . . . . . . . . . . (6)
Conservation and DSM revenue (offset by expenses). . . . . . . . . . . . . . . . . . . . . . . . . . . . . . . . . . . . . (5)
Other, net. . . . . . . . . . . . . . . . . . . . . . . . . . . . . . . . . . . . . . . . . . . . . . . . . . . . . . . . . . . . . . . . . . . . . . . 13
Total increase in electric margin. . . . . . . . . . . . . . . . . . . . . . . . . . . . . . . . . . . . . . . . . . . . . . . . . . . . $ 118
(a) Decrease is primarily due to the expiration of a long-term wholesale power sales agreement with Black Hills Corp., effective Jan. 1, 2012.
2012 Comparison to 2011 — The increase in electric margin was primarily due to the various rate increases across all of the utility
subsidiaries.
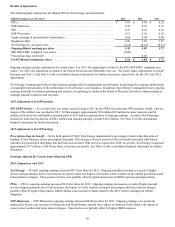
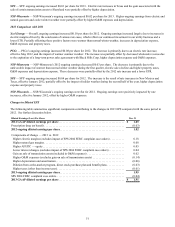
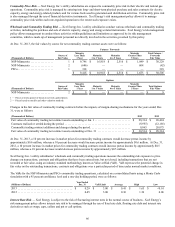
Natural Gas Revenues and Margin
The cost of natural gas tends to vary with changing sales requirements and the cost of natural gas purchases. However, due to the
design of purchased natural gas cost recovery mechanisms to recover current expenses for sales to retail customers, fluctuations in the
cost of natural gas have little effect on natural gas margin. The following table details natural gas revenues and margin:
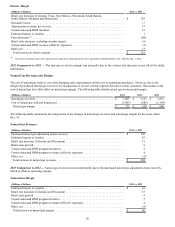
(Millions of Dollars) 2013 2012 2011
Natural gas revenues . . . . . . . . . . . . . . . . . . . . . . . . . . . . . . . . . . . . . . . . . . . . . . . . . . . . . . $ 1,805 $ 1,537 $ 1,812
Cost of natural gas sold and transported . . . . . . . . . . . . . . . . . . . . . . . . . . . . . . . . . . . . . . . (1,083)(881) (1,164)
Natural gas margin . . . . . . . . . . . . . . . . . . . . . . . . . . . . . . . . . . . . . . . . . . . . . . . . . . . . . . $ 722 $ 656 $ 648
The following tables summarize the components of the changes in natural gas revenues and natural gas margin for the years ended
Dec. 31:
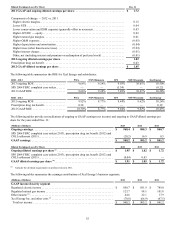
Natural Gas Revenues
(Millions of Dollars) 2013 vs. 2012
Purchased natural gas adjustment clause recovery . . . . . . . . . . . . . . . . . . . . . . . . . . . . . . . . . . . . . . . $ 198
Estimated impact of weather . . . . . . . . . . . . . . . . . . . . . . . . . . . . . . . . . . . . . . . . . . . . . . . . . . . . . . . . 42
Retail rate increases (Colorado and Wisconsin) . . . . . . . . . . . . . . . . . . . . . . . . . . . . . . . . . . . . . . . . . 15
Retail sales growth . . . . . . . . . . . . . . . . . . . . . . . . . . . . . . . . . . . . . . . . . . . . . . . . . . . . . . . . . . . . . . . 9
Conservation and DSM program incentives . . . . . . . . . . . . . . . . . . . . . . . . . . . . . . . . . . . . . . . . . . . . 5
Conservation and DSM program revenues (offset by expenses) . . . . . . . . . . . . . . . . . . . . . . . . . . . . 4
Other, net. . . . . . . . . . . . . . . . . . . . . . . . . . . . . . . . . . . . . . . . . . . . . . . . . . . . . . . . . . . . . . . . . . . . . . . (5)
Total increase in natural gas revenues. . . . . . . . . . . . . . . . . . . . . . . . . . . . . . . . . . . . . . . . . . . . . . . . $ 268
2013 Comparison to 2012 — Natural gas revenues increased primarily due to the purchased natural gas adjustment clause recovery,
which is offset in operating expense.
Natural Gas Margin
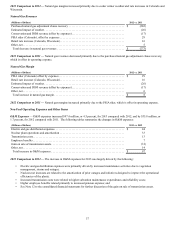
(Millions of Dollars) 2013 vs. 2012
Estimated impact of weather . . . . . . . . . . . . . . . . . . . . . . . . . . . . . . . . . . . . . . . . . . . . . . . . . . . . . . . . $ 42
Retail rate increases (Colorado and Wisconsin) . . . . . . . . . . . . . . . . . . . . . . . . . . . . . . . . . . . . . . . . . 15
Retail sales growth . . . . . . . . . . . . . . . . . . . . . . . . . . . . . . . . . . . . . . . . . . . . . . . . . . . . . . . . . . . . . . . 9
Conservation and DSM program incentive. . . . . . . . . . . . . . . . . . . . . . . . . . . . . . . . . . . . . . . . . . . . . 5
Conservation and DSM program revenues (offset by expenses) . . . . . . . . . . . . . . . . . . . . . . . . . . . . 4
Other, net. . . . . . . . . . . . . . . . . . . . . . . . . . . . . . . . . . . . . . . . . . . . . . . . . . . . . . . . . . . . . . . . . . . . . . . (9)
Total increase in natural gas margin . . . . . . . . . . . . . . . . . . . . . . . . . . . . . . . . . . . . . . . . . . . . . . . . . $ 66