Xcel Energy 2013 Annual Report Download - page 31
Download and view the complete annual report
Please find page 31 of the 2013 Xcel Energy annual report below. You can navigate through the pages in the report by either clicking on the pages listed below, or by using the keyword search tool below to find specific information within the annual report.-
 1
1 -
2
-
3
-
4
-
5
-
6
-
7
-
8
-
9
-
10
-
11
-
12
-
13
-
14
-
15
-
16
-
17
-
18
-
19
-
20
-
 21
21 -
 22
22 -
 23
23 -
 24
24 -
 25
25 -
 26
26 -
 27
27 -
 28
28 -
 29
29 -
 30
30 -
 31
31 -
 32
32 -
 33
33 -
 34
34 -
 35
35 -
 36
36 -
 37
37 -
 38
38 -
 39
39 -
 40
40 -
 41
41 -
42
-
43
-
44
-
45
-
46
-
47
-
48
-
49
-
50
-
51
-
52
-
53
-
54
-
55
-
56
-
57
-
58
-
59
-
60
-
61
-
62
-
63
-
64
-
65
-
66
-
67
-
68
-
69
-
70
-
71
-
72
-
73
-
74
-
75
-
76
-
77
-
78
-
79
-
80
-
81
-
82
-
83
-
84
-
85
-
86
-
87
-
88
-
89
-
90
-
91
-
92
-
93
-
94
-
95
-
96
-
97
-
98
-
99
-
100
-
101
-
102
-
103
-
104
-
105
-
106
-
107
-
108
-
109
-
110
-
111
-
112
-
113
-
114
-
115
-
116
-
117
-
118
-
119
-
120
-
121
-
122
-
123
-
124
-
125
-
126
-
127
-
128
-
129
-
130
-
131
-
132
-
133
-
134
-
135
-
136
-
137
-
138
-
139
-
140
-
141
-
142
-
143
-
144
-
145
-
146
-
147
-
148
-
149
-
150
-
151
-
152
-
153
-
154
-
155
-
156
-
157
-
158
-
159
-
160
-
161
-
162
-
163
-
164
-
165
-
166
-
167
-
168
-
169
-
170
-
171
-
172
-
173
-
174
-
175
-
176
-
177
-
178
-
179
-
180
 |
 |
13
NSP-Minnesota and NSP-Wisconsin have contracted for coal supplies to provide 94 percent of their estimated coal requirements in
2014, and a declining percentage of the requirements in subsequent years. The NSP System’s general coal purchasing objective is to
contract for approximately 100 percent of requirements for the following year, 67 percent of requirements in two years, and 33 percent
of requirements in three years. Remaining requirements will be filled through the procurement process or over-the-counter
transactions.
NSP-Minnesota and NSP-Wisconsin have a number of coal transportation contracts that provide for delivery of 100 percent of their
coal requirements in 2014 and 2015. Coal delivery may be subject to short-term interruptions or reductions due to operation of the
mines, transportation problems, weather and availability of equipment.
Nuclear — To operate NSP-Minnesota’s nuclear generating plants, NSP-Minnesota secures contracts for uranium concentrates,
uranium conversion, uranium enrichment and fuel fabrication. The contract strategy involves a portfolio of spot purchases and
medium and long-term contracts for uranium concentrates, conversion services and enrichment services with multiple producers and
with a focus on diversification to minimize potential impacts caused by supply interruptions due to geographical and world political
issues.
• Current nuclear fuel supply contracts cover 100 percent of uranium concentrates requirements through 2018 and approximately
67 percent of the requirements for 2019 through 2026.
• Current contracts for conversion services cover 100 percent of the requirements through 2021 and approximately 57 percent of
the requirements for 2022 through 2026.
• Current enrichment service contracts cover 100 percent of the requirements through 2024 and approximately 48 percent of the
requirements for 2025 through 2026.
Fabrication services for Monticello and Prairie Island are 100 percent committed through 2027 and 2019, respectively.
NSP-Minnesota expects sufficient uranium concentrates, conversion services and enrichment services to be available for the total fuel
requirements of its nuclear generating plants. Some exposure to spot market price volatility will remain due to index-based pricing
structures contained in certain supply contracts.
Natural gas — The NSP System uses both firm and interruptible natural gas supply and standby oil in combustion turbines and certain
boilers. Natural gas supplies and associated transportation and storage services for power plants are procured under contracts with
various terms to provide an adequate supply of fuel. However, as natural gas primarily serves intermediate and peak demand,
remaining forecasted requirements are able to be procured through a liquid spot market. Generally, natural gas supply contracts have
pricing that is tied to various natural gas indices. Most transportation contract pricing is based on FERC approved transportation tariff
rates. These transportation rates are subject to revision based upon FERC approval of changes in the timing or amount of allowable
cost recovery by providers. Certain natural gas supply and transportation agreements include obligations for the purchase and/or
delivery of specified volumes of natural gas or to make payments in lieu of delivery. At Dec. 31, 2013 and 2012, the NSP System did
not have any commitments related to gas supply contracts; however commitments related to gas transportation and storage contracts
were approximately $389 million and $384 million, respectively. Commitments related to gas transportation and storage contracts
expire in various years from 2014 to 2028.
The NSP System also has limited on-site fuel oil storage facilities and primarily relies on the spot market for incremental supplies.
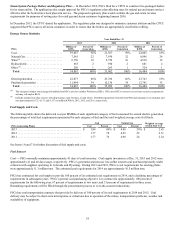
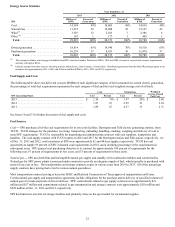
Renewable Energy Sources
The NSP System’s renewable energy portfolio includes wind, hydroelectric, biomass and solar power from both owned generating
facilities and PPAs. As of Dec. 31, 2013, the NSP System was in compliance with mandated RPS, which require generation from
renewable resources of 18 percent and 8.89 percent of NSP-Minnesota and NSP-Wisconsin electric retail sales, respectively.
Renewable energy comprised 22.9 percent and 22.4 percent of the NSP System’s total owned and purchased energy for 2013 and
2012, respectively. Wind energy comprised 12.6 percent and 11.9 percent of the total owned and purchased energy on the NSP
System for 2013 and 2012, respectively. Hydroelectric energy comprised 7.4 percent and 7.0 percent of the total owned and
purchased energy on the NSP System for 2013 and 2012, respectively. Biomass and solar power comprised approximately 3.0 percent
and 3.5 percent of the total owned and purchased energy on the NSP System for 2013 and 2012, respectively.