Volvo 2012 Annual Report Download - page 99
Download and view the complete annual report
Please find page 99 of the 2012 Volvo annual report below. You can navigate through the pages in the report by either clicking on the pages listed below, or by using the keyword search tool below to find specific information within the annual report.-
 1
1 -
2
-
3
-
4
-
5
-
6
-
7
-
8
-
9
-
10
-
11
-
12
-
13
-
14
-
15
-
16
-
17
-
18
-
19
-
20
-
21
-
22
-
23
-
24
-
25
-
26
-
27
-
28
-
29
-
30
-
31
-
32
-
33
-
34
-
35
-
36
-
37
-
38
-
39
-
40
-
41
-
42
-
43
-
44
-
45
-
46
-
47
-
48
-
49
-
50
-
51
-
52
-
53
-
54
-
55
-
56
-
57
-
58
-
59
-
60
-
61
-
62
-
63
-
64
-
65
-
66
-
67
-
68
-
69
-
70
-
71
-
72
-
73
-
74
-
75
-
76
-
77
-
78
-
79
-
80
-
81
-
82
-
83
-
84
-
85
-
86
-
87
-
88
-
 89
89 -
 90
90 -
 91
91 -
 92
92 -
 93
93 -
 94
94 -
 95
95 -
 96
96 -
 97
97 -
 98
98 -
 99
99 -
 100
100 -
 101
101 -
 102
102 -
 103
103 -
 104
104 -
 105
105 -
 106
106 -
 107
107 -
 108
108 -
 109
109 -
110
-
111
-
112
-
113
-
114
-
115
-
116
-
117
-
118
-
119
-
120
-
121
-
122
-
123
-
124
-
125
-
126
-
127
-
128
-
129
-
130
-
131
-
132
-
133
-
134
-
135
-
136
-
137
-
138
-
139
-
140
-
141
-
142
-
143
-
144
-
145
-
146
-
147
-
148
-
149
-
150
-
151
-
152
-
153
-
154
-
155
-
156
-
157
-
158
-
159
-
160
-
161
-
162
-
163
-
164
-
165
-
166
-
167
-
168
-
169
-
170
-
171
-
172
-
173
-
174
-
175
-
176
-
177
-
178
-
179
-
180
-
181
-
182
-
183
-
184
-
185
-
186
-
187
-
188
-
189
-
190
 |
 |

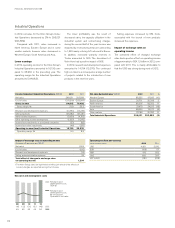
Net financial position, SEK M Industrial Operations Volvo Group
Dec 31
2012
Dec 31
2011
Dec 31
2012
Dec 31
2011
Non-currentinterest-bearing assets
Non-current customer-financing
receivables – – 41,156 40,618
Non-current interest-bearing receivables 653 757 337 694
Currentinterest-bearing assets
Customer-financing receivables – – 39,833 38,081
Interest-bearing receivables 3,038 1,461 2,574 667
Internal funding 4,612 2,253 – –
Interest-bearing assets held for sale – 4 – 4
Marketable securities 3,129 6,838 3,130 6,862
Cash and bank 24,017 2 9,113 25,759 30,379
Total financial assets 35,449 40,426 112,789 117, 30 5
Non-currentinterest-bearing liabilities
Bond loans (43,092) (38,192) (43,092) (38,192)
Other loans (33,356) (38,848) (38,433) (47,765)
Internal funding 33,990 35,453 – –
Currentinterest-bearing liabilities
Loans (45,760) (38,644) (50, 317) (44,522)
Internal funding 33,746 24,837 – –
Interest-bearing liabilities held for sale –(6) –(6)
Total financial liabilities (54,472) (55,400) (131,842) (130,485)
Net financial position excl. post
employment benefits (19,023) (14,974) (19,053) (13,180)
Provision for post employment benefits, net (3,955) (4,372) (3,973) (4,388)
Net financial position incl. post
employment benefits (22,978) (19,346) (23,026) (17,568)
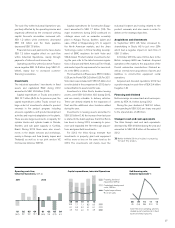
Net debt, Industrial Operations, SEK bn
2011 2012
Q4
(23.0)
Q3
(34.9)
Q2
(27.5)
Q1
(21.8)
Q4
(19.3)
Q3
(29.6)
Q2
(28.3)
Q1
(27.3)
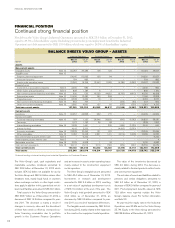
BALANCE SHEETS VOLVO GROUP – SHAREHOLDERS’ EQUITY AND LIABILITIES
Industrial Operations Customer Finance Eliminations Volvo Group
SEK M
Dec 31
2012
Dec 31
2011
Dec 31
2012
Dec 31
2011
Dec 31
2012
Dec 31
2011
Dec 31
2012
Dec 31
2011
Equity and liabilities
Equity attributable to the equity holder of the
Parent Company Note 19 77,055 75,582 8,593 8,999 – – 85,648 84,581
Minority interests Note 11 1,266 1,100 – – – – 1,266 1,100
Total equity 78,321 76,682 8,593 8,999 0 – 86,914 85,681
Non-current provisions
Provisions for post-employment benefits Note 20 6,663 6,635 34 30 – – 6,697 6,665
Provisions for deferred taxes Note 10 3,149 4,171 1,879 1,465 – – 5,028 5,636
Other provisions Note 21 5,588 5,492 187 154 8 2 5,783 5,648
Total non-current provisions 15,400 16,298 2,100 1,649 8 2 17, 50 8 17, 9 49
Non-current liabilities Note 22
Bond loans 43,092 38,192 – – – – 43,092 38,192
Other loans 33,356 38,848 11,630 8, 974 (6,553) (57) 38,433 47,765
Internal funding1(33,990) (35,453) 34,298 33,459 (308) 1,994 – –
Other liabilities 13,828 12,902 742 740 (3,856) (3,195) 10,714 10,447
Total non-current liabilities 56,286 54,489 46,670 43,173 (10,717) (1,258) 92,239 96,404
Current provisions Note 21 10,916 9,438 50 92 10 1 10,976 9,531
Current liabilities Note 22
Loans 45,760 38,644 6,393 6,741 (1,836) (863) 50,317 44,522
Internal funding1(33,746) (24,837) 38,600 35,373 (4,854) (10,536) – –
Non interest-bearing liabilities held for sale Note 3 – 4,710 – – – – – 4,710
Interest-bearing liabilities held for sale Note 3 – 6 – – – – – 6
Trade payables 47,205 56,546 159 242 – – 47,364 56,788
Tax liabilities 807 2,220 (154) 171 – – 653 2,391
Other liabilities Note 22 32,299 34,880 3,803 2,707 (3,331) (2,325) 32,771 35,262
Total current liabilities 92,325 112,169 48,801 45,234 (10,021) (13,724) 131,105 143,679
Total equity and liabilities 253,248 269,076 106,214 99,147 (20,720) (14,979) 338 ,742 353,244
1 Internal funding is internal lending from Industrial Operations to Customer Finance.
Change in net financial position,
Industrial Operations, SEK bn 2012 2011
Net financial position at the
beginning of period (19.3) (24.7)
Cash flow from operating activities 12.4 26.9
Investments in fixed assets (to)/from (18.2) (14.0)
Disposals 0.9 1.2
Operating cash-flow (4.9) 14.1
Investments and divestments of shares (1.2) (0.1)
Acquired and divested operations, net 3.7 (3.0)
Capital injections (to)/from Customer
Finance Operations 0.9 (0.1)
Currency effect 3.6 (1.9)
Dividend paidto AB Volvo shareholders (6.1) (5.1)
Dividend paid to minority shareholders 0.0 0.0
Other 0.3 1.5
Total change (3.7) 5.4
Net financial position at end of
period (23.0) (19.3)
95