Volvo 2012 Annual Report Download - page 5
Download and view the complete annual report
Please find page 5 of the 2012 Volvo annual report below. You can navigate through the pages in the report by either clicking on the pages listed below, or by using the keyword search tool below to find specific information within the annual report.-
 1
1 -
 2
2 -
 3
3 -
 4
4 -
 5
5 -
 6
6 -
 7
7 -
 8
8 -
 9
9 -
 10
10 -
 11
11 -
 12
12 -
 13
13 -
 14
14 -
 15
15 -
 16
16 -
17
-
18
-
19
-
20
-
21
-
22
-
23
-
24
-
25
-
26
-
27
-
28
-
29
-
30
-
31
-
32
-
33
-
34
-
35
-
36
-
37
-
38
-
39
-
40
-
41
-
42
-
43
-
44
-
45
-
46
-
47
-
48
-
49
-
50
-
51
-
52
-
53
-
54
-
55
-
56
-
57
-
58
-
59
-
60
-
61
-
62
-
63
-
64
-
65
-
66
-
67
-
68
-
69
-
70
-
71
-
72
-
73
-
74
-
75
-
76
-
77
-
78
-
79
-
80
-
81
-
82
-
83
-
84
-
85
-
86
-
87
-
88
-
89
-
90
-
91
-
92
-
93
-
94
-
95
-
96
-
97
-
98
-
99
-
100
-
101
-
102
-
103
-
104
-
105
-
106
-
107
-
108
-
109
-
110
-
111
-
112
-
113
-
114
-
115
-
116
-
117
-
118
-
119
-
120
-
121
-
122
-
123
-
124
-
125
-
126
-
127
-
128
-
129
-
130
-
131
-
132
-
133
-
134
-
135
-
136
-
137
-
138
-
139
-
140
-
141
-
142
-
143
-
144
-
145
-
146
-
147
-
148
-
149
-
150
-
151
-
152
-
153
-
154
-
155
-
156
-
157
-
158
-
159
-
160
-
161
-
162
-
163
-
164
-
165
-
166
-
167
-
168
-
169
-
170
-
171
-
172
-
173
-
174
-
175
-
176
-
177
-
178
-
179
-
180
-
181
-
182
-
183
-
184
-
185
-
186
-
187
-
188
-
189
-
190
 |
 |

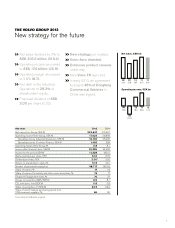
THE VOLVO GROUP 2012
New strategy for the future
Key ratios 2012 2011
Net sales Volvo Group, SEK M 303,647 310,367
Operating income Volvo Group, SEK M 17,622 26,899
Operating income Industrial Operations, SEK M 16,130 25,930
Operating income Customer Finance, SEK M 1,492 969
Operating margin Volvo Group, % 5.8 8.7
Income after financial items, SEK M 15,355 24,929
Income for the period, SEK M 11,258 18 ,115
Diluted earnings per share, SEK 5.44 8.75
Dividend per share, SEK 3.0013.00
Return on shareholders' equity, % 12.9 23.1
Number of permanent employees 98,717 98,162
Share of women, % 17 18
Share of women,Presidents and other senior executives, % 19 17
Employee Engagement Index, % 76 76
Energy consumption, MWh/SEK M 8.5 8.1
CO2 emissions, tons/SEK M 0.8 0.8
Water consumption, m3/SEK M 24.9 26.2
Share of direct material purchasing spend from
CSR assessed suppliers, % 66 60
1 According to the Board’s proposal.
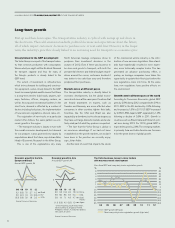
Net sales declined by 2% to
SEK 303.6 billion (310.4).
Operating income amounted
to SEK 17.6 billion (26.9).
Operating margin decreased
to 5.8% (8.7).
Net debt in the Industrial
Operations of 29.3% of
shareholders’ equity.
Proposed dividend of SEK
3.00 per share (3.00).
Net sales, SEK bn
1211100908
304310265218304
Operating income, SEK bn
100808
09
(17.0)
18.015,915.9
12
17.6
11
26.9
New strategy put in place.
Volvo Aero divested.
Extensive product renewal
under way.
New Volvo FH launched.
In early 2013, an agreement
to acquire 45% of Dongfeng
Commercial Vehicles in
China was signed.
1