Volvo 2012 Annual Report Download - page 123
Download and view the complete annual report
Please find page 123 of the 2012 Volvo annual report below. You can navigate through the pages in the report by either clicking on the pages listed below, or by using the keyword search tool below to find specific information within the annual report.-
 1
1 -
2
-
3
-
4
-
5
-
6
-
7
-
8
-
9
-
10
-
11
-
12
-
13
-
14
-
15
-
16
-
17
-
18
-
19
-
20
-
21
-
22
-
23
-
24
-
25
-
26
-
27
-
28
-
29
-
30
-
31
-
32
-
33
-
34
-
35
-
36
-
37
-
38
-
39
-
40
-
41
-
42
-
43
-
44
-
45
-
46
-
47
-
48
-
49
-
50
-
51
-
52
-
53
-
54
-
55
-
56
-
57
-
58
-
59
-
60
-
61
-
62
-
63
-
64
-
65
-
66
-
67
-
68
-
69
-
70
-
71
-
72
-
73
-
74
-
75
-
76
-
77
-
78
-
79
-
80
-
81
-
82
-
83
-
84
-
85
-
86
-
87
-
88
-
89
-
90
-
91
-
92
-
93
-
94
-
95
-
96
-
97
-
98
-
99
-
100
-
101
-
102
-
103
-
104
-
105
-
106
-
107
-
108
-
109
-
110
-
111
-
112
-
 113
113 -
 114
114 -
 115
115 -
 116
116 -
 117
117 -
 118
118 -
 119
119 -
 120
120 -
 121
121 -
 122
122 -
 123
123 -
 124
124 -
 125
125 -
 126
126 -
 127
127 -
 128
128 -
 129
129 -
 130
130 -
 131
131 -
 132
132 -
 133
133 -
134
-
135
-
136
-
137
-
138
-
139
-
140
-
141
-
142
-
143
-
144
-
145
-
146
-
147
-
148
-
149
-
150
-
151
-
152
-
153
-
154
-
155
-
156
-
157
-
158
-
159
-
160
-
161
-
162
-
163
-
164
-
165
-
166
-
167
-
168
-
169
-
170
-
171
-
172
-
173
-
174
-
175
-
176
-
177
-
178
-
179
-
180
-
181
-
182
-
183
-
184
-
185
-
186
-
187
-
188
-
189
-
190
 |
 |

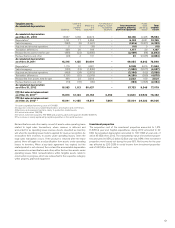
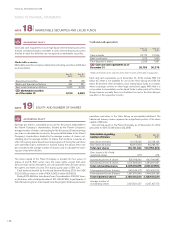
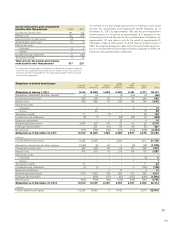
Intangible assets, acquisition costs Entrance fees,
industrial programs
Capitalized product
and software
development Other intangible
assets2Total intangible
assets Goodwill1
Acquisition cost as of Dec 31, 2010 22,936 3,800 27,851 6,889 61,476
Capital expenditures3–109 4,238 122 4,469
Sales/scrapping –(484) (657) (323) (1,464)
Acquired and divested operations 967 0(4) 0963
Translation differences 272 1431 (32) 672
Reclassified to assets held for sale (274) (3,199) (1,963) (60) (5,496)
Reclassifications and others (2) (3) 654 55
Acquisition cost as of Dec 31, 2011 23,899 224 29,902 6,650 60,675
Capital expenditures3– 93 5,385 101 5,579
Sales/scrapping – (14) (1,738) (12) (1,764)
Acquired and divested operations 588 (3,182) (2,109) 52 (4,651)
Translation differences (1,446) (11) (1,479) (592) (3,528)
Reclassifiedfrom assets held for sale 297 3,198 1,958 60 5,513
Reclassifications and other 0(19) (23) (55) (97)
Acquisition cost as of Dec 31, 2012 23,338 289 31,896 6,204 61,727
Accumulated amortization
and impairment Entrance fees,
industrial programs
Capitalized product
and software
development Other intangible
assets2Total intangible
assets Goodwill1
Accumulated amortization and impairment
as of Dec 31, 2010 –1,820 16,271 2,671 20,762
Amortization and impairment5–76 2,788 383 3,247
Sales/scrapping –(265) (406) (322) (993)
Acquired and divested operations – 0 0 0 0
Translation differences – 0 312 33 345
Reclassified to assets held for sale – (1,596) (570) (24) (2,190)
Reclassifications and other –(2) 1(2) (3)
Accumulated amortization and impairment
as of Dec 31, 2011 – 33 18,396 2,739 21,168
Amortization and impairment5–55 2,749 387 3,191
Sales/scrapping – 0 (1,734) (12) (1,746)
Acquired and divested operations –(1,633) (547) (29) (2,209)
Translation differences –(1) (942) (188) (1,131)
Reclassifiedfrom assets held for sale – 1,602 572 24 2,198
Reclassifications and other –(6) (38) (73) (117)
Accumulated amortization and impairment
as of Dec 31, 2012 – 50 18,456 2,848 21,354
B/S Net value in balance sheet
as of December 31, 2011423,899 191 11, 506 3,911 39,507
B/S Net value in balance sheet
as of December 31, 2012423,338 239 13,440 3,356 40,373
1 Includes on the date of IFRS adoption, costs of 14,184 and accumulated amortization of 3,863.
2 Other intangible assets mainly consist of trademarks and distribution networks.
3 Includes capitalized borrowing costs of 295 (112).
4 Costs less accumulated, amortization and impairments.
5 Of which impairments 83 (74).
Goodwill per Business Area Dec 31,
2012 Dec 31,
2011
Trucks 12,759 13,828
Construction Equipment 7,462 7,764
Buses 1,145 1,169
Volvo Rents 1,469 990
Other business areas 503 148
Total goodwill value 23,338 23,899
119