Volvo 2012 Annual Report Download - page 25
Download and view the complete annual report
Please find page 25 of the 2012 Volvo annual report below. You can navigate through the pages in the report by either clicking on the pages listed below, or by using the keyword search tool below to find specific information within the annual report.-
 1
1 -
2
-
3
-
4
-
5
-
6
-
7
-
8
-
9
-
10
-
11
-
12
-
13
-
14
-
 15
15 -
 16
16 -
 17
17 -
 18
18 -
 19
19 -
 20
20 -
 21
21 -
 22
22 -
 23
23 -
 24
24 -
 25
25 -
 26
26 -
 27
27 -
 28
28 -
 29
29 -
 30
30 -
 31
31 -
 32
32 -
 33
33 -
 34
34 -
 35
35 -
36
-
37
-
38
-
39
-
40
-
41
-
42
-
43
-
44
-
45
-
46
-
47
-
48
-
49
-
50
-
51
-
52
-
53
-
54
-
55
-
56
-
57
-
58
-
59
-
60
-
61
-
62
-
63
-
64
-
65
-
66
-
67
-
68
-
69
-
70
-
71
-
72
-
73
-
74
-
75
-
76
-
77
-
78
-
79
-
80
-
81
-
82
-
83
-
84
-
85
-
86
-
87
-
88
-
89
-
90
-
91
-
92
-
93
-
94
-
95
-
96
-
97
-
98
-
99
-
100
-
101
-
102
-
103
-
104
-
105
-
106
-
107
-
108
-
109
-
110
-
111
-
112
-
113
-
114
-
115
-
116
-
117
-
118
-
119
-
120
-
121
-
122
-
123
-
124
-
125
-
126
-
127
-
128
-
129
-
130
-
131
-
132
-
133
-
134
-
135
-
136
-
137
-
138
-
139
-
140
-
141
-
142
-
143
-
144
-
145
-
146
-
147
-
148
-
149
-
150
-
151
-
152
-
153
-
154
-
155
-
156
-
157
-
158
-
159
-
160
-
161
-
162
-
163
-
164
-
165
-
166
-
167
-
168
-
169
-
170
-
171
-
172
-
173
-
174
-
175
-
176
-
177
-
178
-
179
-
180
-
181
-
182
-
183
-
184
-
185
-
186
-
187
-
188
-
189
-
190
 |
 |

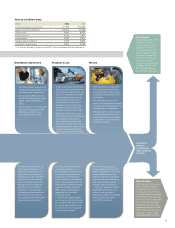
Investments
A significant portion of the
income for the year is
transferred back into the
operation. The capital is
used for investing in activi-
ties to strengthen competi-
tiveness and create long-
term value for the Group’s
stakeholders. Of the
income for the year of SEK
11,258 M (18,115), SEK
5,175 M (12,033) was
returned to the operations.
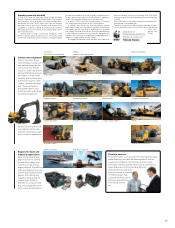
Distribution and service Products in use Re-use
• The Volvo Group’s products are
distributed through wholly-owned
and independent dealerships.
• Since the year 2000 net sales
for the Volvo Group has risen by
133% to SEK 303.6 billion in
2012.
• Selling expenses in the Industrial
Operations amounted to SEK
26.6 billion in 2012, corre-
sponding to 9.0% of sales.
• Remanufactured components
are important to the offering,
which can help to reduce own-
ership and operating costs for
customers.
• The Volvo Group takes into
account resource efficiency and
recycling potential already in the
development of its products.
• We have stations where trucks,
buses and equipment are dis-
assembled and where reusable
components are utilized, refur-
bished and tested.
Shareholders
Of the income for the year of
SEK 11,258 M, AB Volvo
shareholders will receive a
certain portion in the form of
a dividend, after the operation
has received necessary capi-
tal for continued development
according to the strategies.
The Board of Directors has
proposed a dividend of SEK
3.00 (3.00) per share, corre-
sponding to a total of SEK
6,083 M (6,082) for 2012.
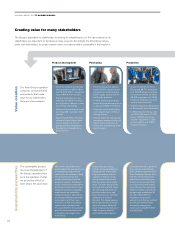
To meet society’s need for effi-
cient transport solutions, co -
operation is necessary. It is in
dialog with its customers that
the Group can fully understand
what drives their businesses
and how the Group can seize
the opportunities to build our
shared success. Customer
satisfaction is not only about
the quality and performance of
our products, but also about
how customers are treated and
how services are delivered.
As a manufacturer of commer-
cial transport solutions, our
products play an important role
in daily life and are important
components in the transport
system. The Group also partici-
pates in the development of effi-
cient transport systems by such
initiatives as Green corridors,
BRT systems, debate about
renewable fuels and trans-
port-policy issues.
Most of the negative impact
from our products occurs during
the use phase. We strive to offer
the right products and services
to achieve safe and energy effi-
cient transport systems.
The Volvo Group’s products
comprise largely of recoverable
material. For example, our trucks
consist of 85% recoverable
material and are manufactured
from as much as one third recy-
cled material. Here, material
strength is the limiting factor.
The Volvo Group also offers
refurbished spare parts as an
option to new, as a way to
extend the useful life, household
with resources and reduce
costs for the customer.
Value by stakeholder group
SEK M 2012 2011
Purchase of goods and services 211,458 214,483
Salaries and remunerations* 39,446 37,039
Social costs* 9,680 8,652
Pension costs* 4,126 3,471
Income taxes 4,097 6,814
Interestpaid to creditors 2,476 2,875
Dividend to shareholders 6,083 6,082
* For further information, please see note 27 to the consolidated financial statements.
Income for
the year
amounted to
SEK 11,258 M
(18 ,115).
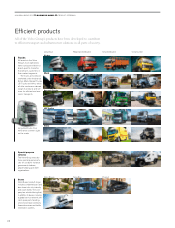
• Trucks manufactured by the Volvo
Group transport goods and prod-
ucts so that society functions, our
buses are important parts of effi-
cient transport systems and our
industrial engines are used as
reserve power, for example, in
hospitals. These are only a few
examples of our products' and
services' contribution to society.
• More than 2 million trucks and
100,000 buses, which the Group
manufactured in the past ten
years, operate on roads world-
wide. At construction sites, there
are more than half a million units of
construction equipment that we
manufactured in the last ten years.
21